

💸 Free Cash Flow Explained
The real bottom line investors should care about

Welcome to the Free edition of How They Make Money.
Over 200,000 subscribers turn to us for business and investment insights.

In case you missed it:
Revenue is vanity.
Profit can be misleading.
Free cash flow doesn’t lie.
As the late Charlie Munger put it:
“Earnings can be fudged. Cash flow is harder to fake.”
Free cash flow is the money left in the bank after operating the business and keeping it running smoothly. No accounting gimmicks. No paper gains. Just real dollars—ready to be reinvested, returned to shareholders, or used to survive tough times.
And yet, despite its importance, free cash flow is often misunderstood.
In this guide, we’ll break down:
What free cash flow means.
Why it matters more than earnings.
How to calculate it (and where to find it).
What to look for when analyzing FCF.
Examples from real companies.
Key pitfalls and red flags.
Let’s demystify one of the most powerful signals in business analysis.

FROM OUR PARTNERS

Snagged.com: Acquire Impossible-to-Get Domain Names
Snagged helps clients acquire premium, hard-to-obtain digital assets.
Led by Rob Schutz (co-founder and former Chief Growth Officer at Ro), they help companies navigate the opaque and often confusing world of domain names.
They’ve worked with everyone from scrappy founders to public companies, securing deals like Kit.com, Slash.com, Kickstart.com, Bilt.com, World.org, and more.
Snagged offers a free initial assessment to gauge feasibility (budget, owner, etc), then handles research, outreach, negotiation, and transfer—so you don’t end up WhatsApp’ing a domain investor in the UAE at 2am.
Their reputation is top-tier, with endorsements from Garry Tan (Y Combinator), Alexis Ohanian (Reddit, 776), and John Zimmer (Lyft).
Dream domain in mind? Selling a premium one? Or just want to geek out on domains?

📊 What Is Free Cash Flow?
Free cash flow (FCF) is the cash a company generates after covering its core operating expenses (OpEx) and capital expenditures (CapEx).
Sounds like finance jargon?
👉 Check out our free series covering how to analyze financial statements.
That’s where we walk you through the trifecta of finance:
⚖️ Balance Sheet.
📊 Income Statement.
💵 Cash Flow Statement.
In simple terms:
Free Cash Flow = [Cash from Operations – Capital Expenditures]It’s what’s left over after a business pays to run and maintain itself. Actual usable cash.
That’s why many investors treat it as the real bottom line.
💡 A Simple Analogy
Imagine you run a lemonade stand:
You earn $1,000 selling lemonade (Revenue).
You spend $400 on lemons, sugar, and cups (OpEx).
You spend $200 on a new juicer (CapEx).
Your free cash flow is:
[$1,000 – $400 – $200] = $400An asset like a juicer would be depreciated over several years in the income statement, but the cash leaves the bank account all at once.
🧾 Where to Find It
You won’t find “free cash flow” directly in the financial statements, but you can calculate it easily by checking the cash flow statement in the 10-Q or 10-K filing.
Find Cash Flow from Operations.
Subtract Capital Expenditures (often called “Purchase of property and equipment”).
And voila!
Some companies report it directly. Many don’t. But the math is universal.
🧮 A Simple Example
Free cash flow may sound like finance jargon, but the math is simple.
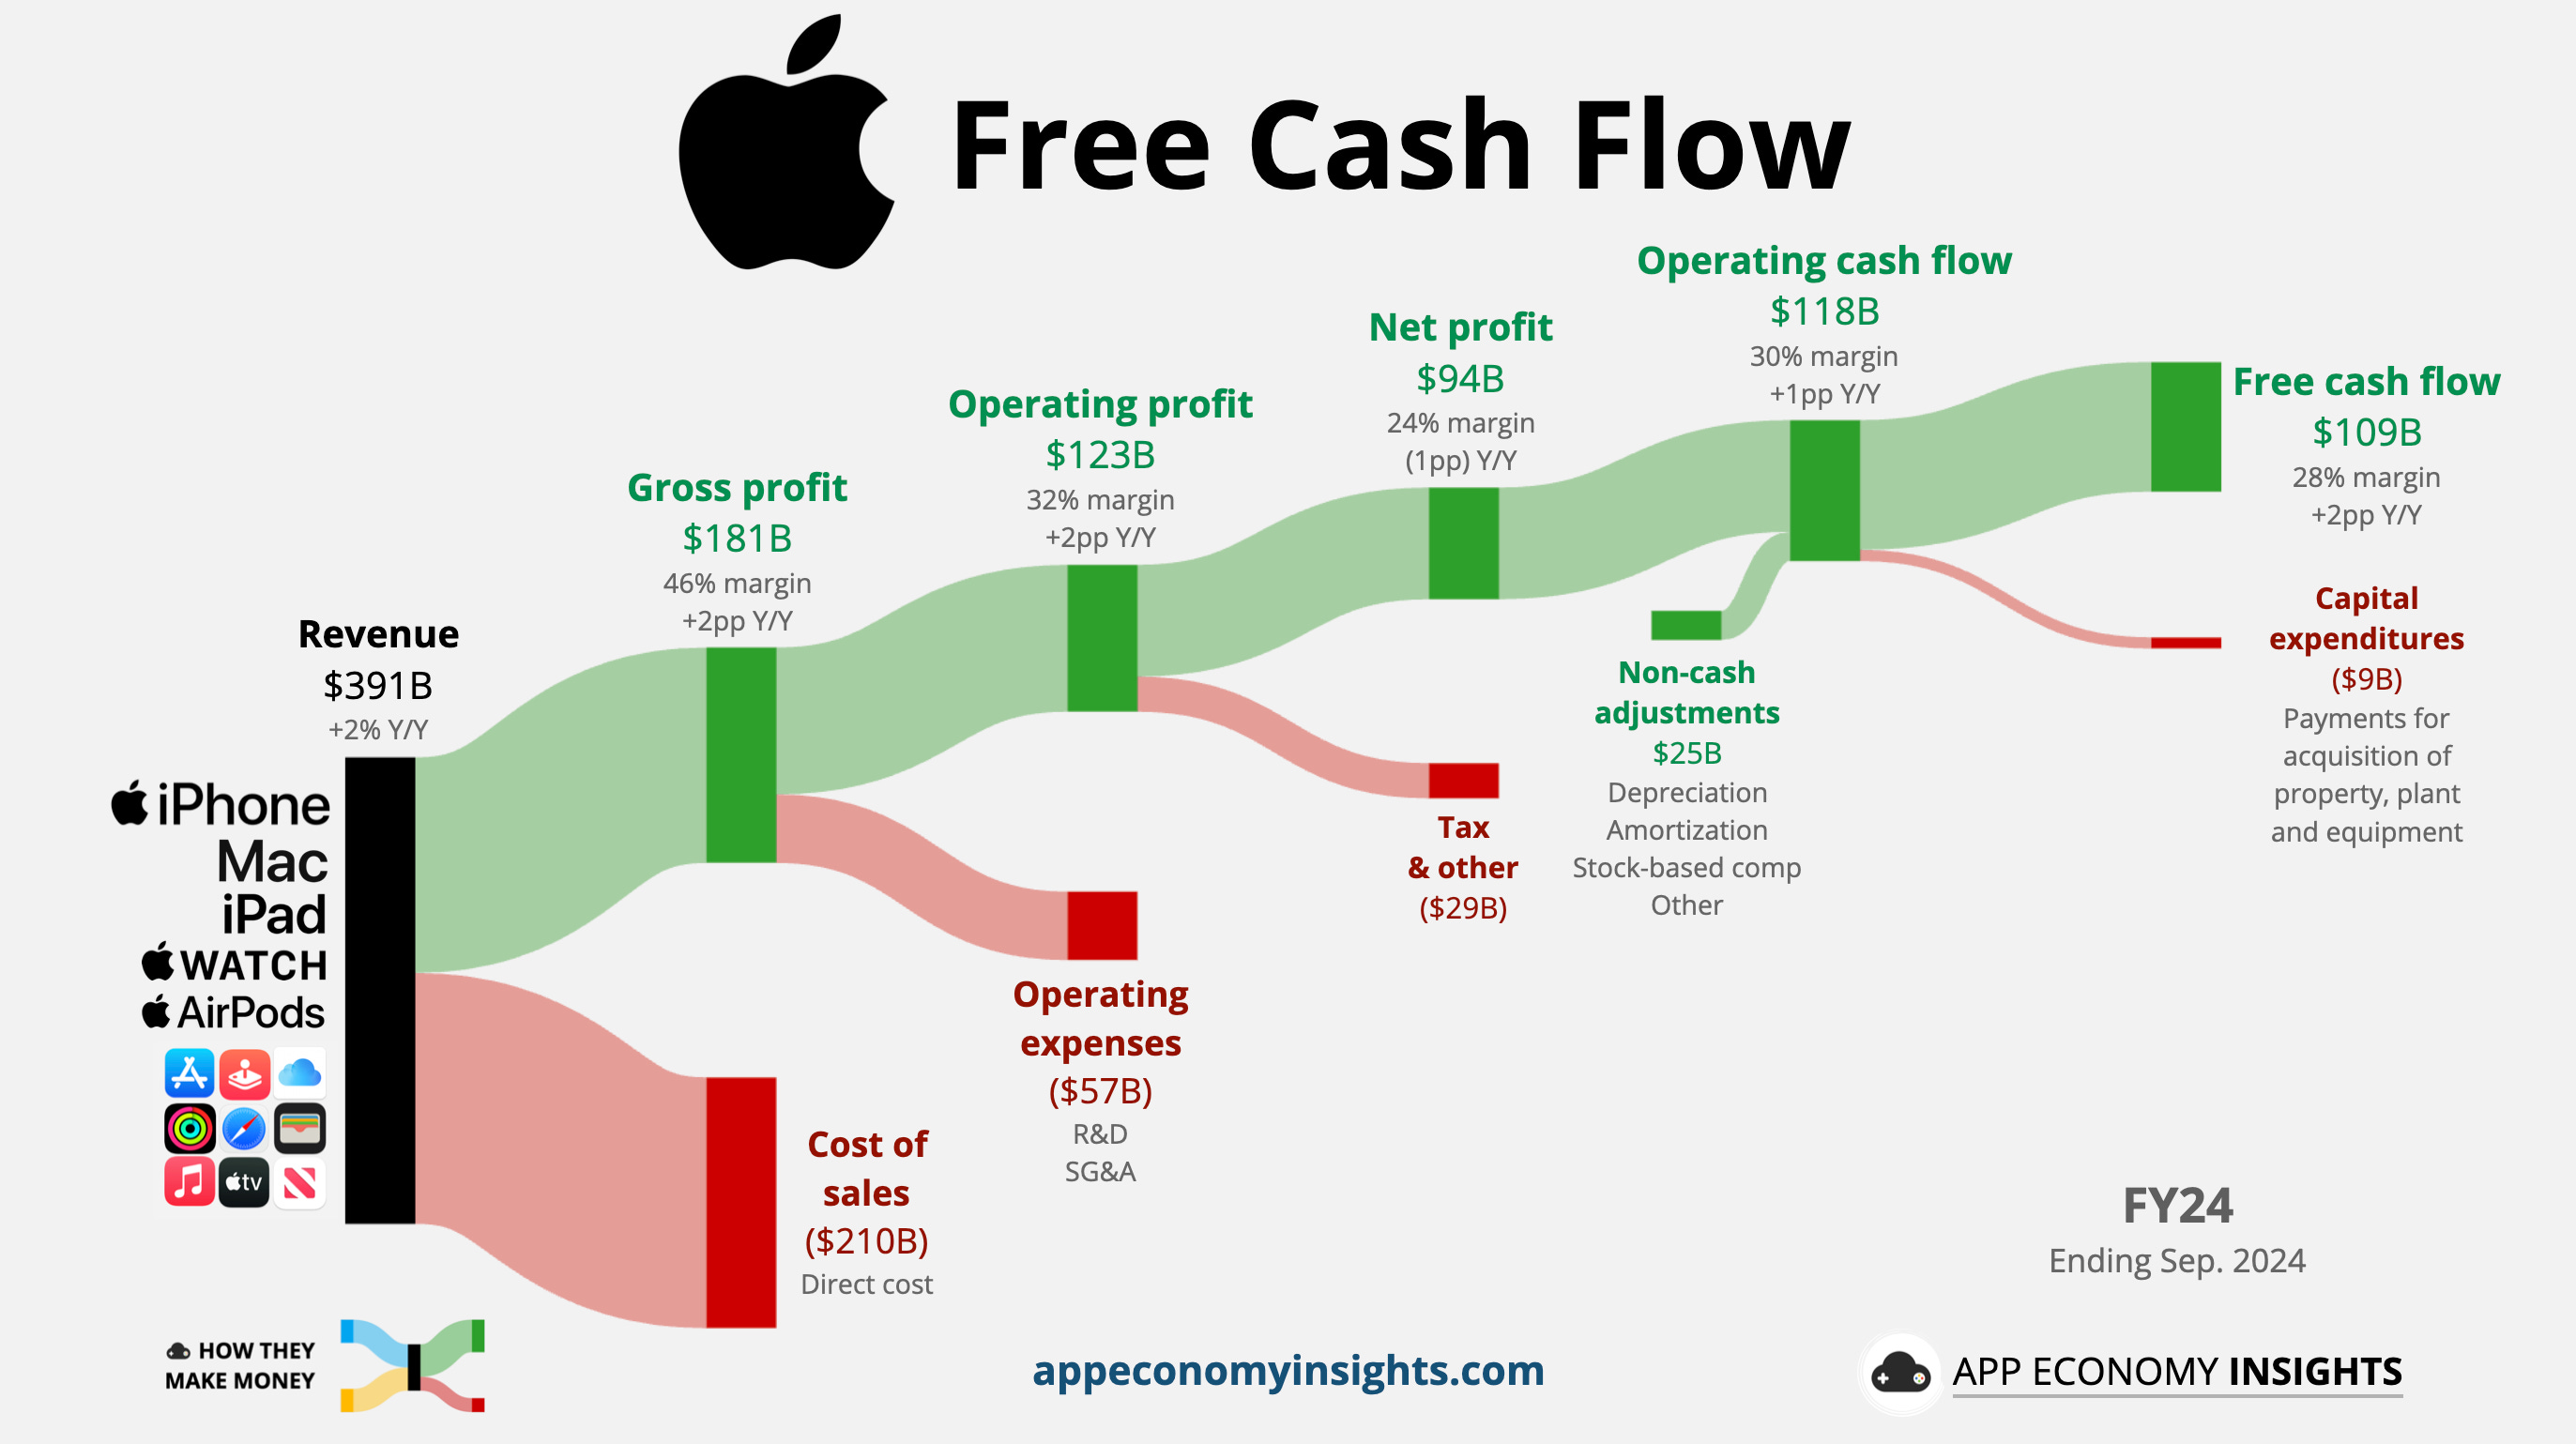
Let’s visualize it with Apple’s FY24 free cash flow.
Many of our articles visualize the income statement, which shows the underlying operations: [revenue less expenses] = profit.
But we have to go 2 steps further to analyze the FCF.
🔹 Step 1: Start with Operating Cash Flow
This is the cash a company brings in from its core business—selling products or services. It’s the first major line on the cash flow statement, often called:
Net cash provided by operating activities.
Cash from operations.
Operating cash flow.
It all means the same thing.
We start with the net profit provided at the end of the income statement, and we adjust for non-cash items (like depreciation) and working capital changes (like inventory and receivables).
For Apple in FY24:
Net profit was $94 billion.
It included a mix of non-cash items for a net gain of $25 billion.
Operating cash flow was [$94 billion + $25 billion] = $118 billion.
🔹 Step 2: Subtract Capital Expenditures
CapEx is the money spent to maintain or grow the business: buying factories, servers, warehouses, or equipment. This is usually labeled in the cash flow statement as:
Purchase of property, plant, and equipment.
Additions to PP&E.
Apple’s CapEx in FY24 was $9 billion.
✅ That’s It
Apple’s Free Cash Flow = [$118 billion – $9 billion] = $109 billionAfter running its business and reinvesting in its infrastructure, Apple can use its FCF for stock buybacks, dividends, and more.
🏗️ Why It Matters
Free cash flow is what a company can actually use. It’s the fuel behind every meaningful shareholder action. Without it, a business has no flexibility.
Here’s what strong free cash flow enables:
🔁 Reinvestment in the Business
Want to launch a new product? Open a new data center? Expand globally?
FCF funds the future.
Companies with strong FCF can reinvest aggressively over time, without taking on debt or issuing new shares.
💸 Dividends and Buybacks
Free cash flow makes shareholder returns possible.
If a company is paying a dividend without FCF to support it, that’s a red flag.
Buybacks? They’re only sustainable if backed by real cash from the business.
💳 Paying Down Debt
Higher interest rates have made debt expensive again. FCF gives companies breathing room, reducing debt and staying resilient in downturns.
🧠 Optionality
Free cash flow is what gives a company control over its destiny.
It creates room to:
Make acquisitions.
Pivot when needed.
Survive tough cycles.
No cash = no control.
⚖️ Why Not Earnings?
Earnings (net income) can be polluted with one-off accounting gains/losses.
Free cash flow is harder to fake.
Depreciation, amortization, and accruals can inflate or deflate earnings.
FCF tells you how much actual money hit the bank.
That’s why many top investors—Buffett included—focus on FCF first, earnings second.
🚩 What to Watch Out For
Free cash flow is powerful—but it’s not foolproof.
Here are key pitfalls to keep in mind when analyzing it:
📈 One-Time Boosts
A company might sell off an asset—like real estate or a business unit—and report a spike in cash flow.
That looks good… until next year.
Watch for:
“Proceeds from asset sales” on the cash flow statement.
Unusually high FCF not aligned with operating performance.
Always ask: Is this repeatable?
🛠️ CapEx Cuts That Look Like Efficiency
Sometimes companies slash capital expenditures to boost free cash flow in the short term. It makes the numbers look better, but may starve future growth.
If CapEx suddenly drops with no explanation, dig deeper.
Not all CapEx is equal:
Maintenance keeps the engine running.
Growth builds a new engine.
Some investors adjust FCF using only maintenance CapEx, but those figures are rarely disclosed.
🔄 Working Capital Games
A company might delay payments to suppliers or speed up customer collections to juice operating cash flow. This can temporarily inflate free cash flow, but it’s not sustainable.
Look for big swings in accounts payable or receivable.
🧪 Growth Mode ≠ Broken Business
Not all negative FCF is bad. Startups and high-growth firms often invest heavily upfront, sacrificing short-term FCF for long-term payoff.
Think Amazon in its early days. Or Tesla.
Instead of punishing negative FCF, ask:
Is the business reinvesting with discipline?
Does unit economics make sense?
💥 Watch stock-based comp
Free cash flow looks great—until you realize the company paid employees in stock. This is particularly true with US tech companies. That cash didn’t leave the bank account… but your ownership got diluted. We demystify stock-based comp here.
⚖️ Capital-Light vs. Capital-Intensive
Compare FCF within business models. A software company with low CapEx will naturally generate more FCF than a factory-heavy business.
Don’t always assume more FCF = better business.
Context is everything.
🕰️ It’s a Lagging Indicator
Free cash flow tells you what just happened, not what’s coming next.
It reflects decisions made quarters or years ago. A company might post record FCF today… right before demand softens, costs surge, or competition catches up.
Don’t mistake strong FCF for guaranteed momentum.
Always ask: Is this sustainable? What’s changing under the hood?
That’s why you need to pair FCF analysis with forward-looking signals:
New product cycles.
Capital allocation plans.
Customer retention trends.
Competitive landscape shifts.
Great FCF today is nice.
But great FCF tomorrow is what you’re investing in.
🧪 Real Company Profiles
Let’s see how free cash flow plays out in the real world.
Here’s a look at the FCF annual trend of the Magnificent 7 from 2009 to 2024. The stock price appreciation of these stocks has generally followed FCF, except for Tesla.
While NVIDIA looked like Tesla just two years ago, its FCF has surged above Meta and is catching up to Microsoft and Google.

☁️ Amazon: Reinvestment First
While profitable, Amazon reinvests heavily in logistics, cloud infrastructure, and data centers. Its FCF margin is relatively low (6%), but it reflects long-term strategic bets like AI innovation, Project Kuiper (Starlink competitor), and integrated healthcare.
Following the global pandemic, Amazon invested heavily in the regionalization of its fulfillment centers, resulting in faster and cheaper deliveries, improving margins, and expanding the company’s moat in the process. But FCF took a beating in 2021 and 2022 as a result.
🔁 Short-term pain can lead to long-term gains.

🍿 Netflix: From Burn to Surplus
For years, Netflix was deep in the red, burning billions in free cash flow to fund its original content library and international expansion. Today, we all know it turned out to be a prescient strategic decision to dominate in the streaming space.
In the post-pandemic era, the script flipped. With production efficiency, pricing power, and global scale, Netflix has now turned into a cash-printing machine. A new ad tier and password crackdown initiative turned it into overdrive.
Netflix shows that negative FCF isn’t always a negative signal—it can be a bold, long-term strategy. The key is whether the investments eventually create durable operating leverage.
🎬 A decade of investment is now paying off.

🎯 What Investors Should Focus On
So you’re looking at a company’s free cash flow. Now what?
Here’s how to separate the signal from the noise:
📈 FCF Trend
Is free cash flow growing consistently?
One great year means nothing if declines follow.
Look for a multi-year trend that shows durable growth.
📊 FCF Margin
How efficient is the company at converting revenue into free cash?
FCF Margin = [Free Cash Flow ÷ Revenue]20%+ is excellent (common in software and services).
5–15% is solid, depending on the industry.
Negative? It might be due to strategic investments or a warning sign.
🧪 FCF Conversion
Does the company convert its profit into cash?
Free Cash Flow ÷ Net Income
The closer to 100%, the better.
A big gap between reported profits and actual cash? You might need to look closer.
💵 FCF per Share
How much free cash flow is available to each shareholder?
FCF per share = [FCF ÷ Shares outstanding]Unlike Earnings Per Share (EPS), which can be inflated by non-cash accounting, FCF per share reflects real economic value per share.
It’s especially useful when evaluating shareholder yield (dividends + buybacks).
💰 Valuation: Price-to-FCF
Is the stock cheap or expensive relative to its free cash flow?
P/FCF = [Market Cap ÷ Free Cash Flow]Caveat: P/FCF can be misleading if FCF is temporarily inflated or depressed.
Remember, investing is always about looking forward, not backward. It’s best to think in terms of free cash margin at maturity and apply it to future revenue expected.
🧠 Context Is Everything
A low P/FCF might mean a company is in decline.
Low FCF margins can be explained by the specific industry.
A negative FCF might be part of a deliberate growth strategy.
Free cash flow is powerful, but it’s not a shortcut.
It’s a lens, not a crystal ball.
💡 Final Takeaways
Free cash flow is one of the sharpest signals in business analysis.
It’s the fuel that powers everything from reinvestment to shareholder returns.
Here’s what to remember:
It’s not accounting magic. It’s real, spendable cash.
It’s not always obvious. You have to calculate it and put it in context.
It’s not infallible. Always ask if the number is repeatable and sustainable.
Companies with durable, growing free cash flow tend to have pricing power, efficient operations, and optionality in good times and bad.
That’s what long-term investors should care about.
Because at the end of the day, cash is king.
That’s it for today!
Stay healthy and invest on!
Want to sponsor this newsletter? Get in touch here.
Disclosure: I am long AAPL, AMZN, GOOG, META, NFLX, NVDA, and TSLA in App Economy Portfolio. I share my ratings (BUY, SELL, or HOLD) with App Economy Portfolio members.
Author's Note (Bertrand here 👋🏼): The views and opinions expressed in this newsletter are solely my own and should not be considered financial advice or any other organization's views.
Really neat dive into the cash flows. Clean, simple, and sharp.
Great explanation of free cash flow - thank you