

💻 Microsoft: AI Crossroads
Record cloud growth meets OpenAI turmoil

Welcome to the Premium edition of How They Make Money.
Over 230,000 subscribers turn to us for business and investment insights.
In case you missed it:

Microsoft (MSFT) just closed its fiscal year with a blowout quarter.
Revenue smashed expectations across every segment, Azure growth hit 39%, and Copilot adoption is accelerating. GPT‑5 is days away, and Microsoft will have exclusive access.
But a high‑stakes rift with OpenAI is emerging, and the outcome could define Microsoft’s AI edge for years to come.
Here’s what stood out this quarter.
Today at a glance:
Microsoft’s Q4 FY25.
OpenAI drama and risks.
Earnings call takeaways.
What moves the needle.

1. Microsoft’s Q4 FY25
Income Statement:
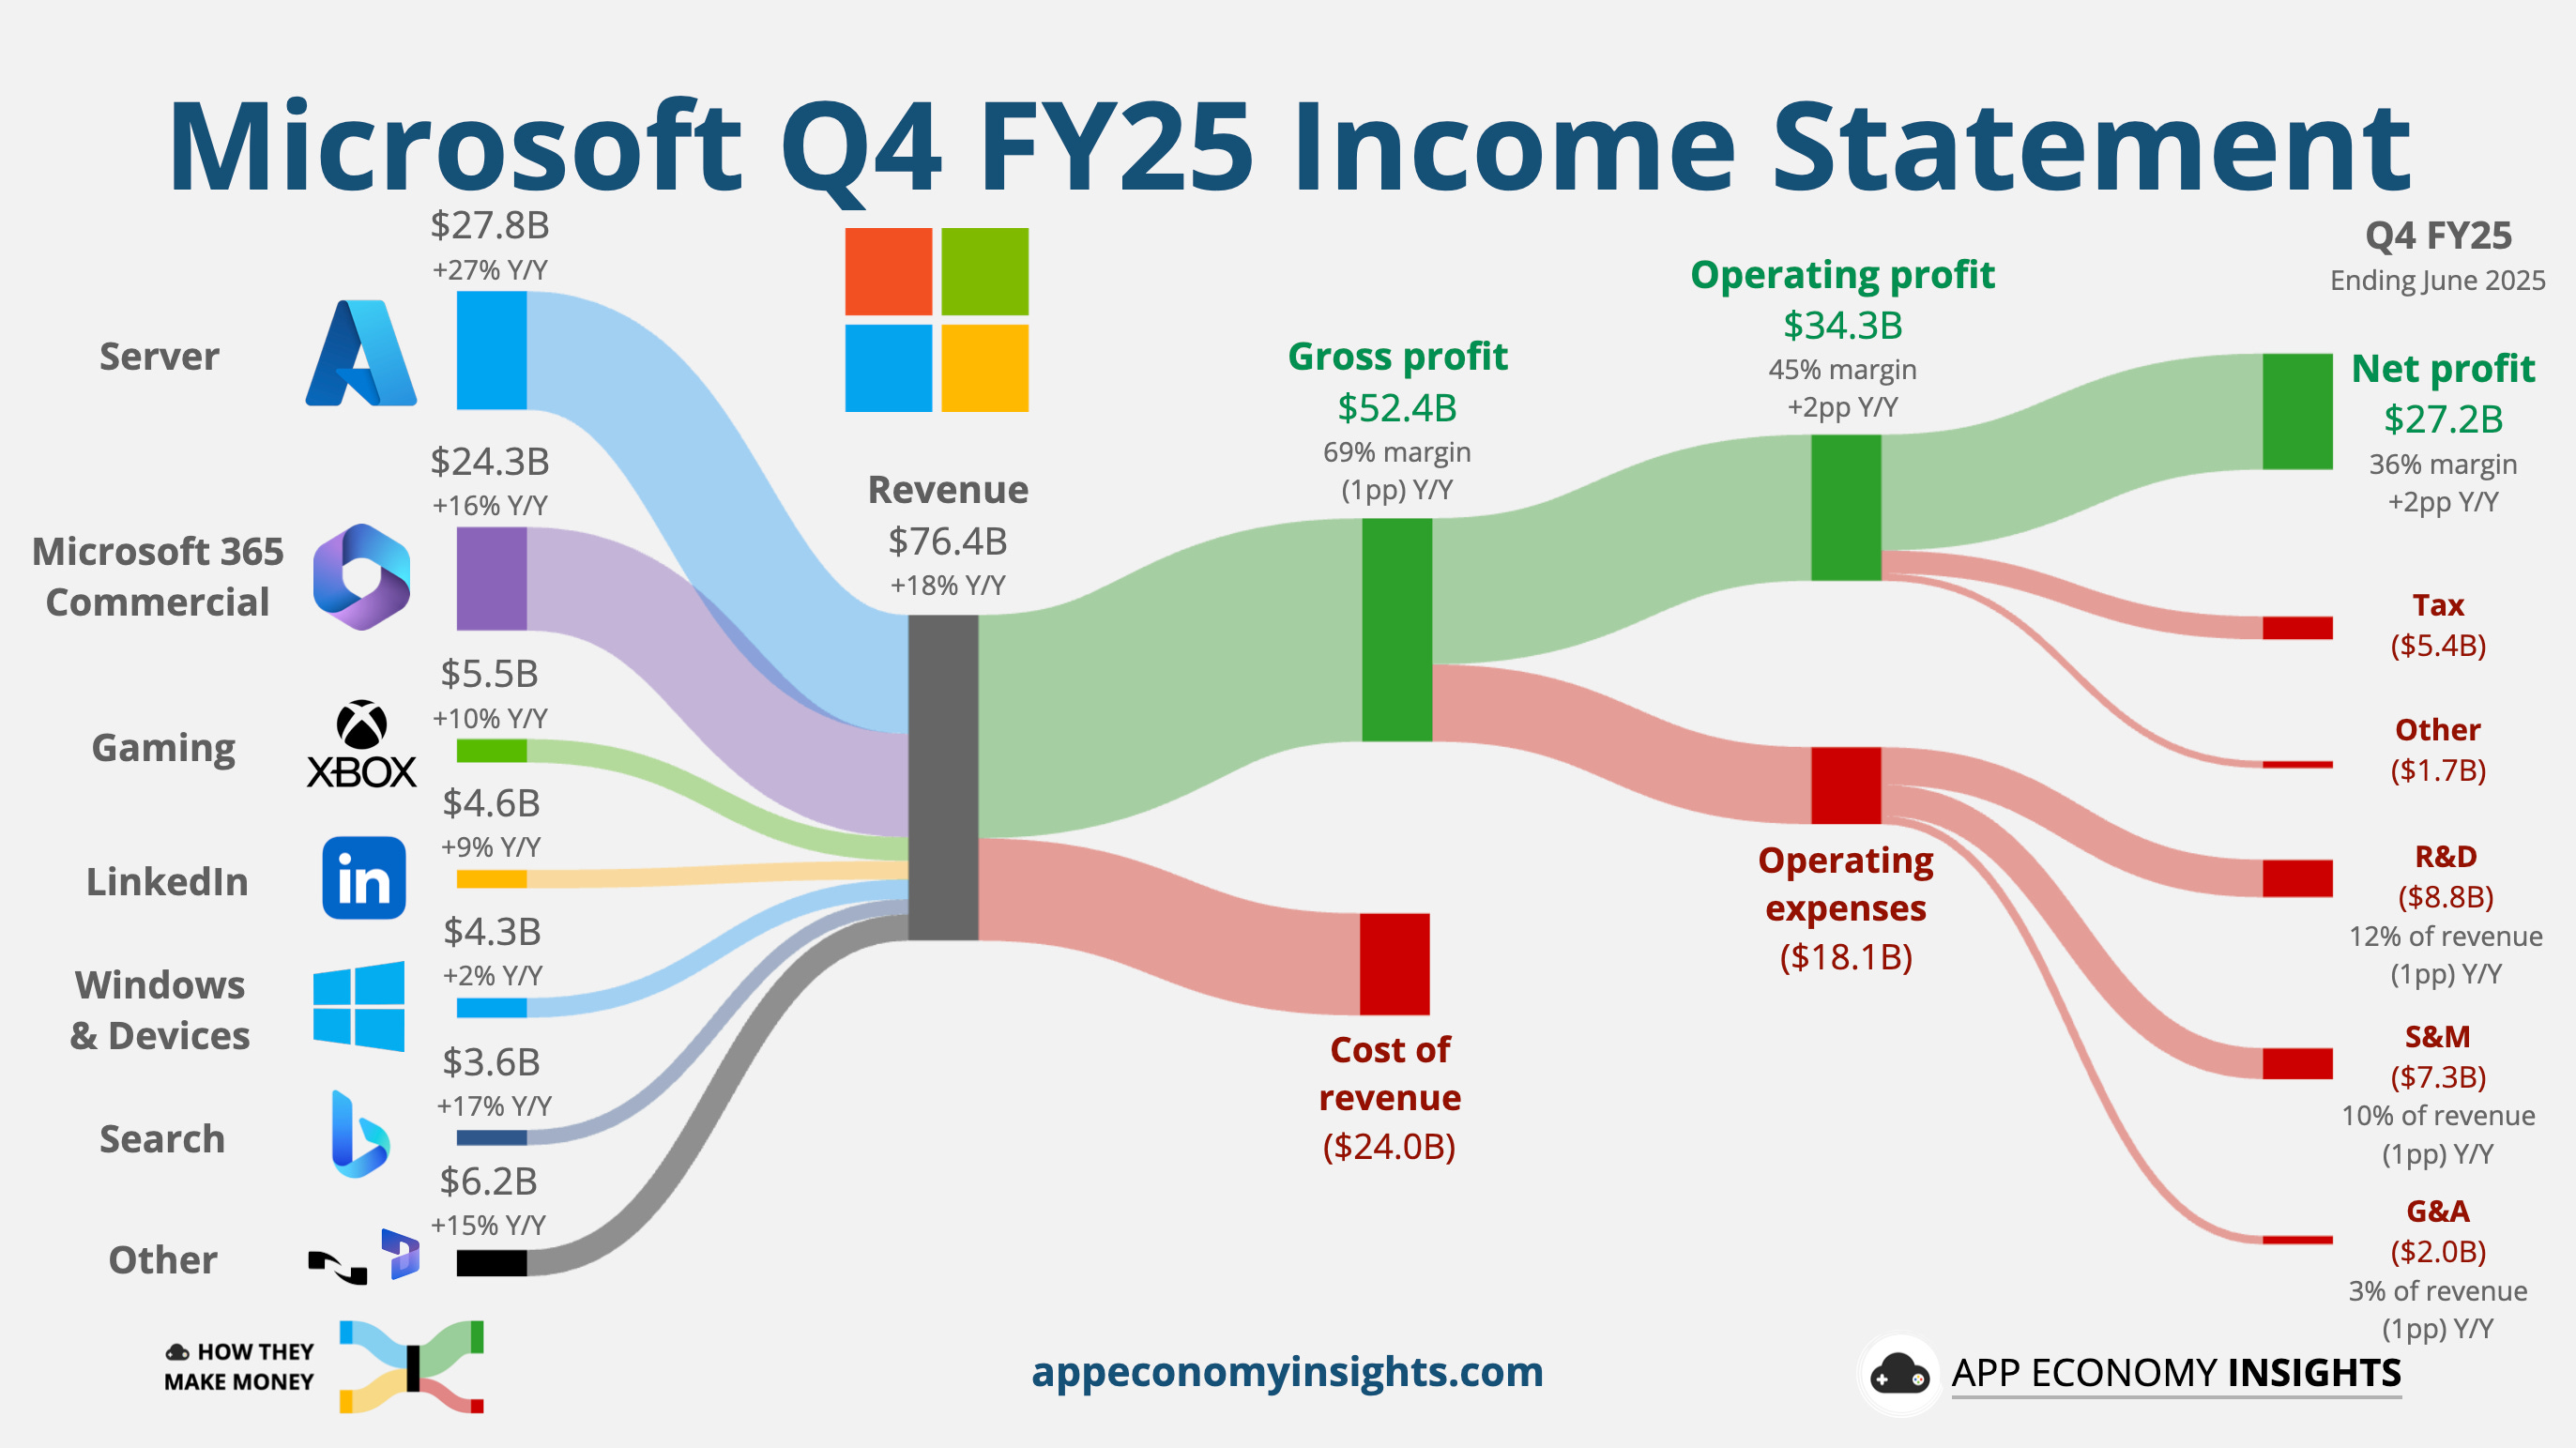
Revenue +18% Y/Y to $76.4B ($2.6B beat).
Gross margin 69% (-1pp Y/Y).
Operating margin 45% (+2pp Y/Y).
EPS $3.65 ($0.27 beat).
Product and Services Breakdown:
☁️ Server products and cloud services $27.8 billion (+27% Y/Y).
📊 M365 Commercial products and cloud services $24.3 billion (+16% Y/Y).
🎮 Gaming $5.5 billion (+10% Y/Y).
👔 LinkedIn $4.6 billion (+9% Y/Y).
🪟 Windows and Devices $4.3 billion (+2% Y/Y).
🔎 Search and news advertising $3.6 billion (+17% Y/Y).
💻 Other $6.2 billion (+15% Y/Y).
Core business segments:
As a reminder, Microsoft restructured its business segments last year to better align reporting with current operations:
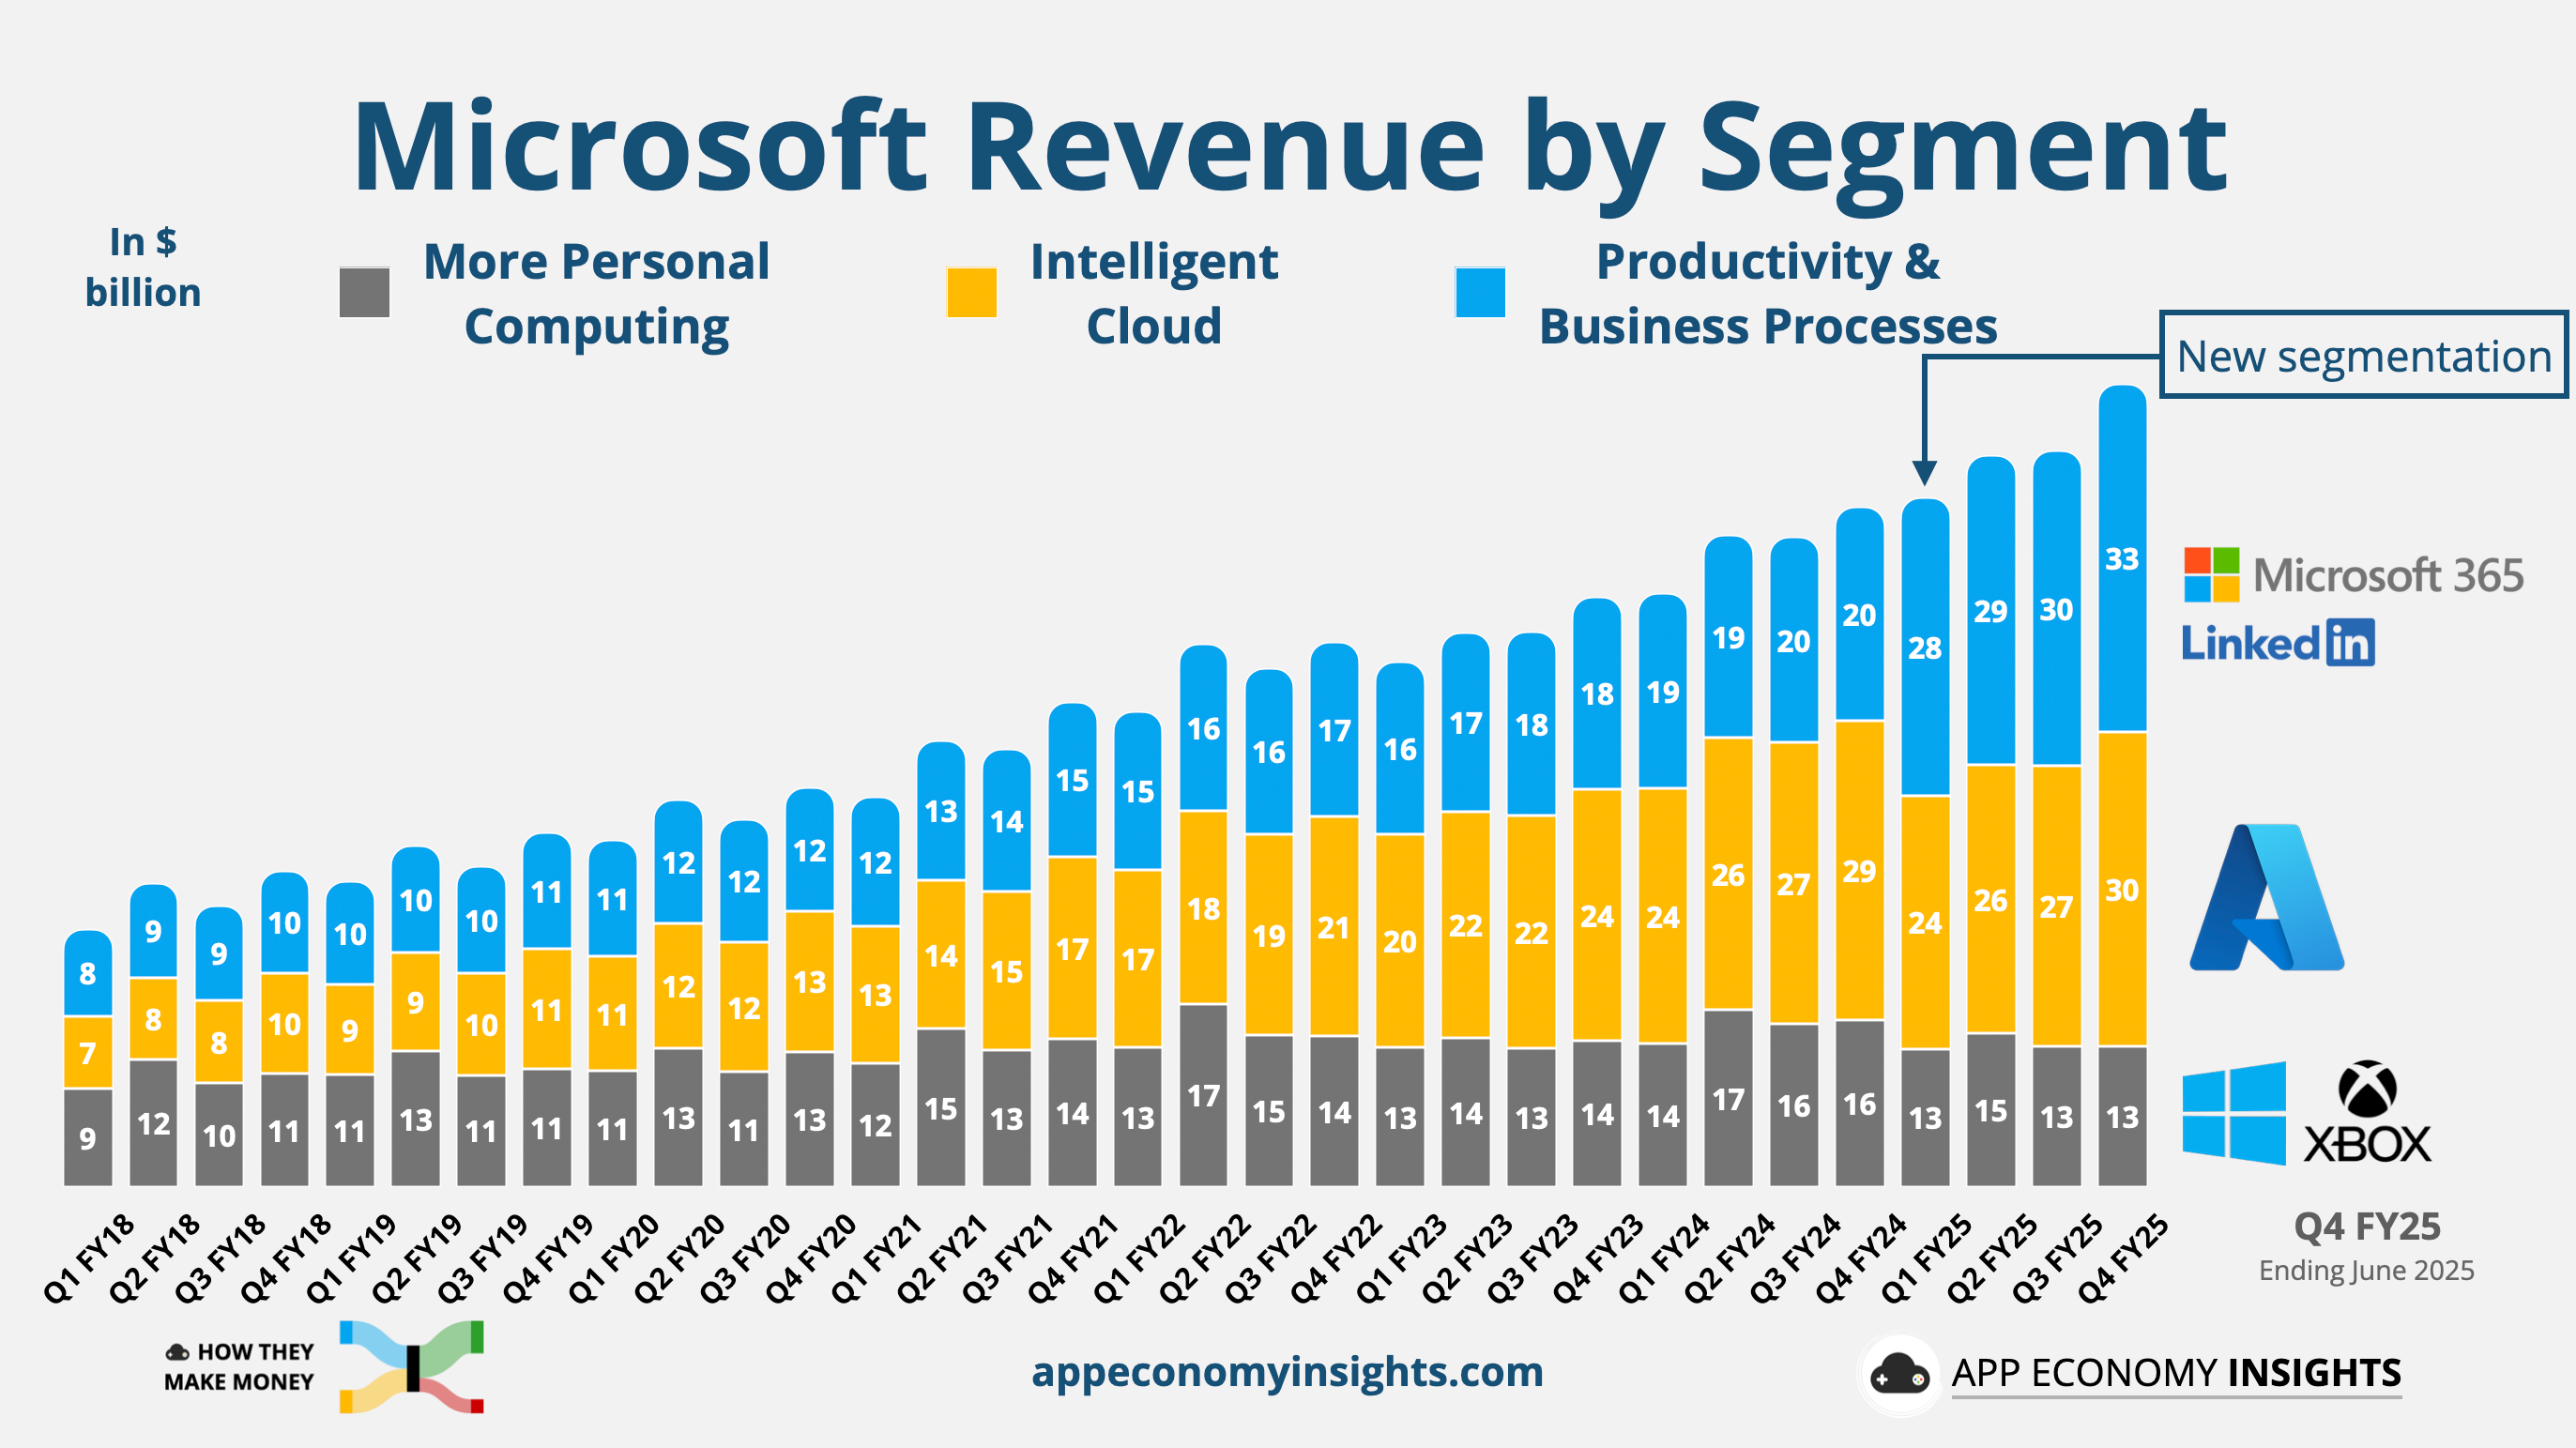
📊 Productivity and Business Processes grew 16% Y/Y to $33.1 billion ($1.0 billion beat). M365 Commercial and Consumer drove upside, with Copilot adoption fueling ARPU gains.
☁️ Intelligent Cloud grew 26% Y/Y to $29.9 billion ($0.8 billion beat), driven by Azure across all workloads.
🎮 More Personal Computing grew 9% Y/Y to $13.5 billion ($0.8 billion beat), with Search and XBOX content driving the upside.
Key Trends:
The table below compares growth year-over-year in constant currency following the new segmentation. Many of the products and services overlap.
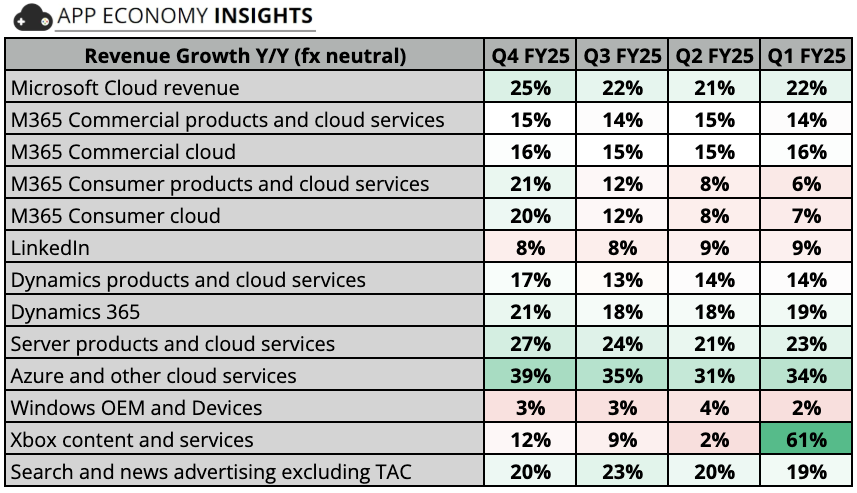
Microsoft Cloud—spanning Azure, M365, and more—grew 25% Y/Y to $46.7 billion. It now accounts for 61% of total revenue, up 4pp Y/Y.
Azure is running the show and driving the growth of ‘Server products and cloud services’ and Microsoft Cloud.
Consumer products saw a big acceleration on the M365 side, boosted by an ARPU growth from the recent price increase and subscriber growth of 8%.
Xbox growth has normalized after the Activision acquisition completed in Q2 FY24, but Game Pass has offset a 22% decline in hardware sales.
Cash flow:
Operating cash flow grew 15% Y/Y to $42.6 billion.
Free cash flow grew 10% Y/Y to $25.6 billion, reflecting higher Capex.
Balance sheet:
Cash, cash equivalents, and investments: $95 billion.
Long-term debt: $40 billion.
So what to make of all this?
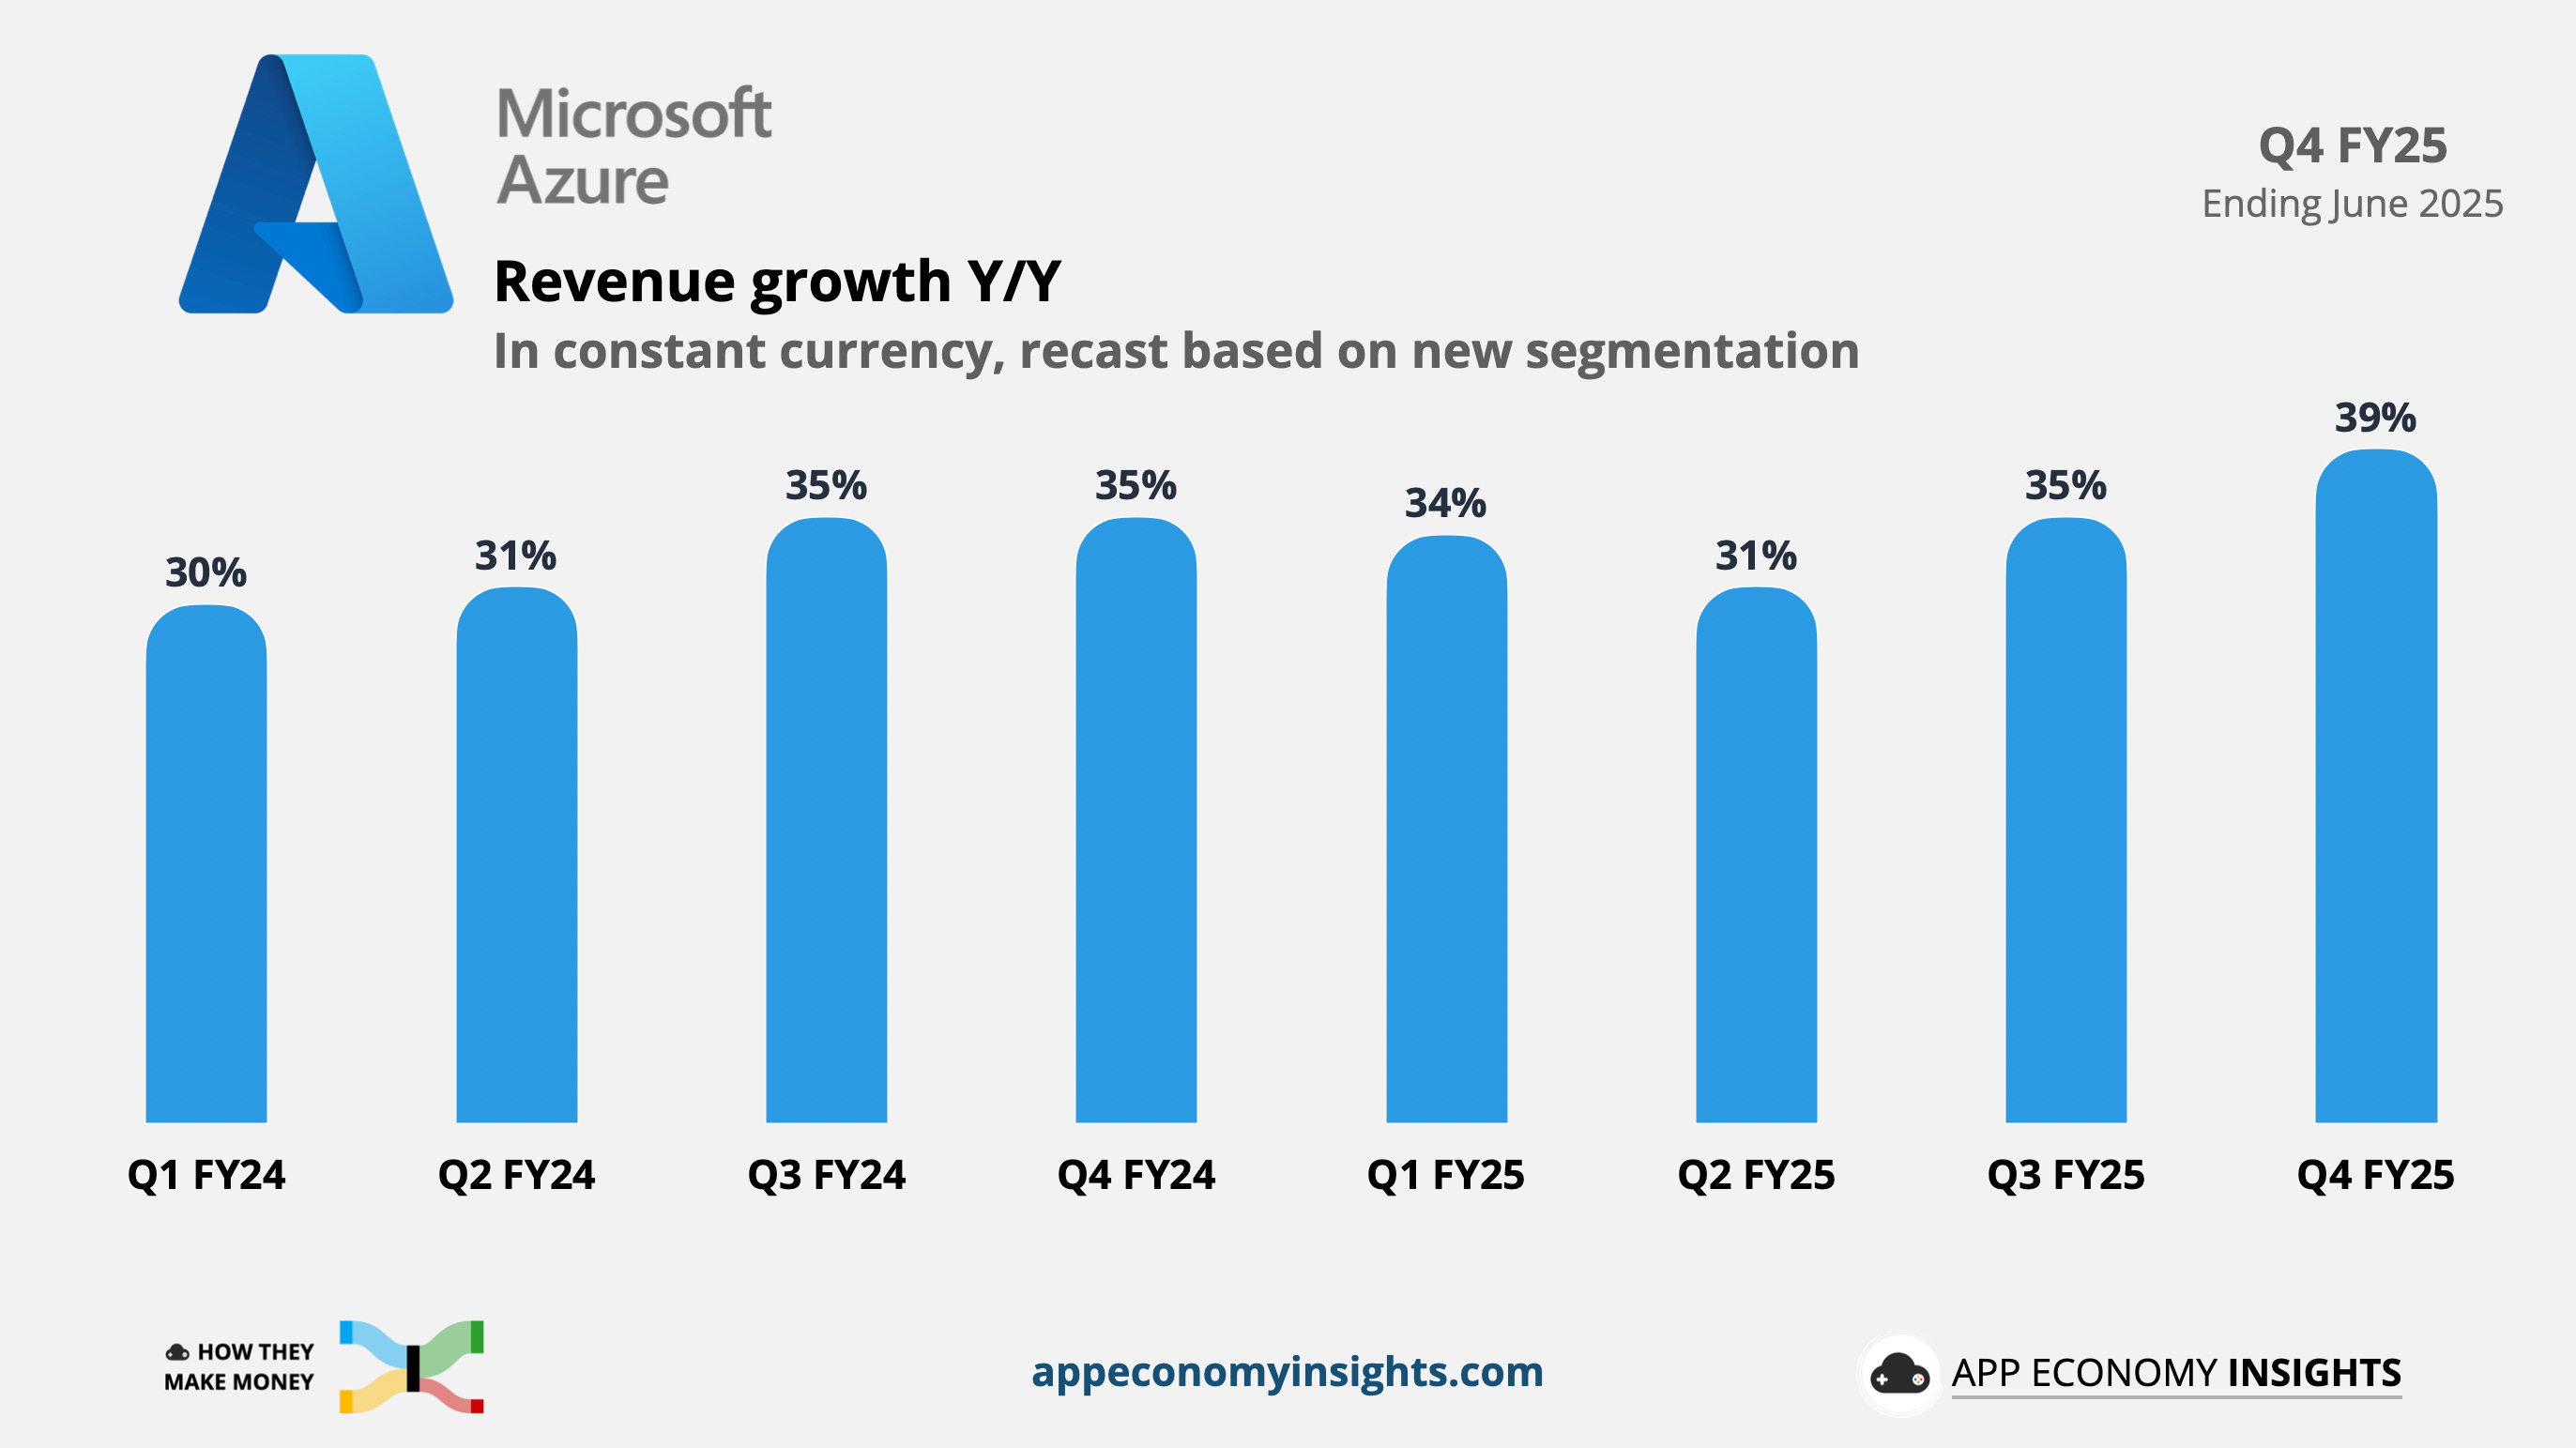
📈 Azure hits a new high: Azure grew 39% Y/Y, far ahead of the 34-35% outlook, driven by core infrastructure demand from large enterprise customers. Surprisingly, management did not share the AI contribution to Azure’s growth this time. But they shared that Azure sales reached $75 billion in the past 12 months (+34% Y/Y). For context, Google Cloud was $49 billion and AWS $112 billion as of March.
🚧 Capacity constrained: Like other hyperscalers, Microsoft’s cloud growth remains constrained by data center shortages. For now, AI-driven demand is outpacing supply, limiting faster acceleration.
💰 Capex soared 27% Y/Y to $24.2 billion: Microsoft is spending aggressively to expand AI infrastructure, catching up with AI demand.
🔎 Search and ads steady: Search and news advertising (ex‑TAC) rose 20% Y/Y, benefiting from volume growth and third‑party partnerships. This segment increasingly captures AI features like Copilot Pro alongside Bing and Edge.
📊 Strong bookings: Commercial bookings climbed 37% Y/Y to over $100 billion, lifting total remaining performance obligations to $368 billion (+37% Y/Y). About 35% of this will convert to revenue over the next 12 months, giving strong forward visibility.
🔺 Margins resilient: Gross margin held at 69%, flat Q/Q, while operating margin improved 2pp Y/Y despite restructuring charges tied to recent layoffs. Efficiency gains helped offset AI infrastructure drag.
🧠 OpenAI’s impact: “Other expenses” of $1.7 billion largely reflect Microsoft’s share of OpenAI’s losses under equity accounting, a growing line item as OpenAI scales aggressively toward GPT‑5.
📅 FY26 guidance: Management guides to double‑digit revenue and operating income growth in FY26, with Azure up ~37% in Q1 (September quarter). Capacity constraints will linger through H1, but CapEx growth is expected to moderate versus FY25.