

📈 How to Analyze a Stock
6 questions to ask before buying any stock

Welcome to the Free edition of How They Make Money.
Over 170,000 subscribers turn to us for business and investment insights.
In case you missed it:
📈 Should I buy this stock?
That’s a question you might have asked yourself.
But where to start? What to look for? What to avoid?
This is your ultimate guide to analyzing a stock from scratch.
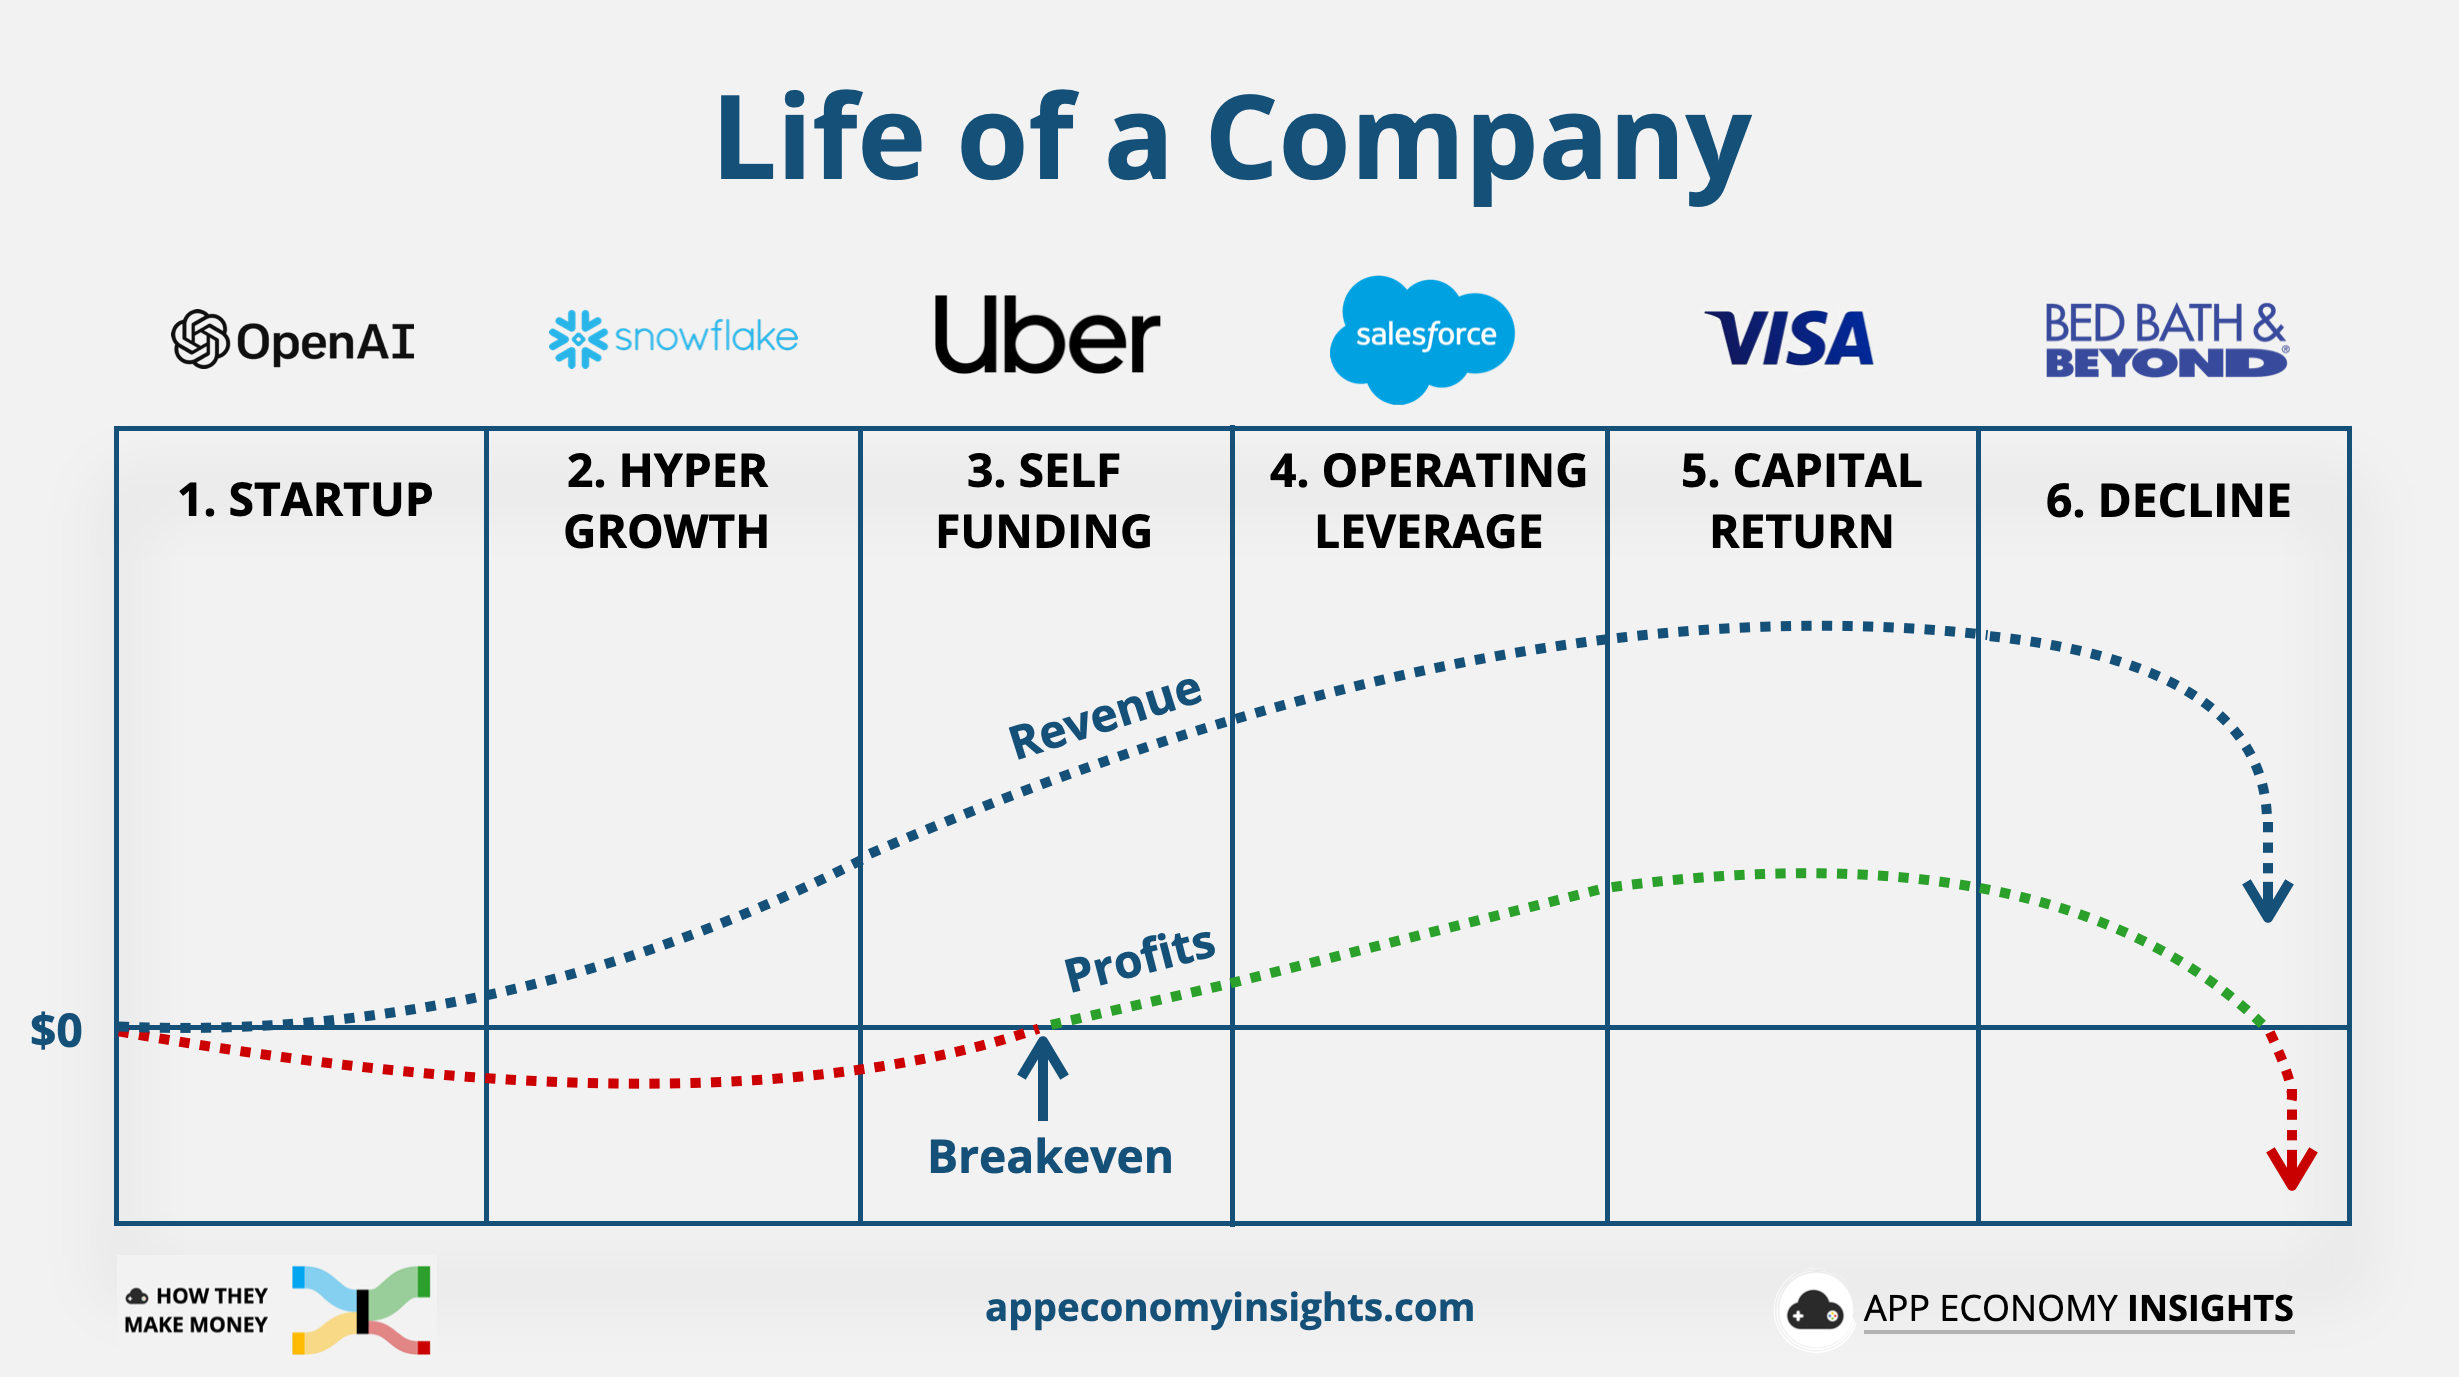
Analyzing a stock begins with the underlying business, not the stock chart. Earnings per share (EPS) growth drives returns, which comes down to revenue growth and margin expansion over time.
Before you hit that “buy” button, ask yourself these 6 questions:
🏢 Company: What’s the business?
💵 Economics: How do they make money?
📈 Opportunities: What could go right?
📉 Risks: What could go wrong?
📊 Financials: What do the numbers say?
💰 Valuation: Is the price right?
These questions will help you decide if a stock is worth your hard-earned money.
Ready to dive in? Let’s go.

1. What’s the business?
Mission: Every great company starts with a mission. It’s the “why” behind what they do. A clear mission can inspire employees, attract customers, and drive long-term success. For example, Google’s mission is "to organize the world’s information and make it universally accessible and useful." Simple, inspirational, and leaves room for new ventures. Ask yourself: Does the company’s mission align with a positive secular trend or unmet need?

Leadership: The team at the top makes all the difference. Founder-led companies or CEOs with a successful track record tend to outperform the market. Leaders with skin in the game—significant stock ownership—often signal alignment with shareholders. Take note of their vision, communication style, and ability to execute. Are they consistent? Do they get a high approval score from employees on platforms like Glassdoor, Comparably, or Great Place To Work? Is the company a desirable place to work and grow your career?

Products: What does the company actually offer? Are its products or services essential, innovative, or part of a growing market? Consider how these offerings solve problems or improve lives. What sets it apart? Pay attention to the company’s competitive position—are its products unique, or do they risk becoming commodities or obsolete? Does the company regularly innovate and launch new products?

2. How do they make money?
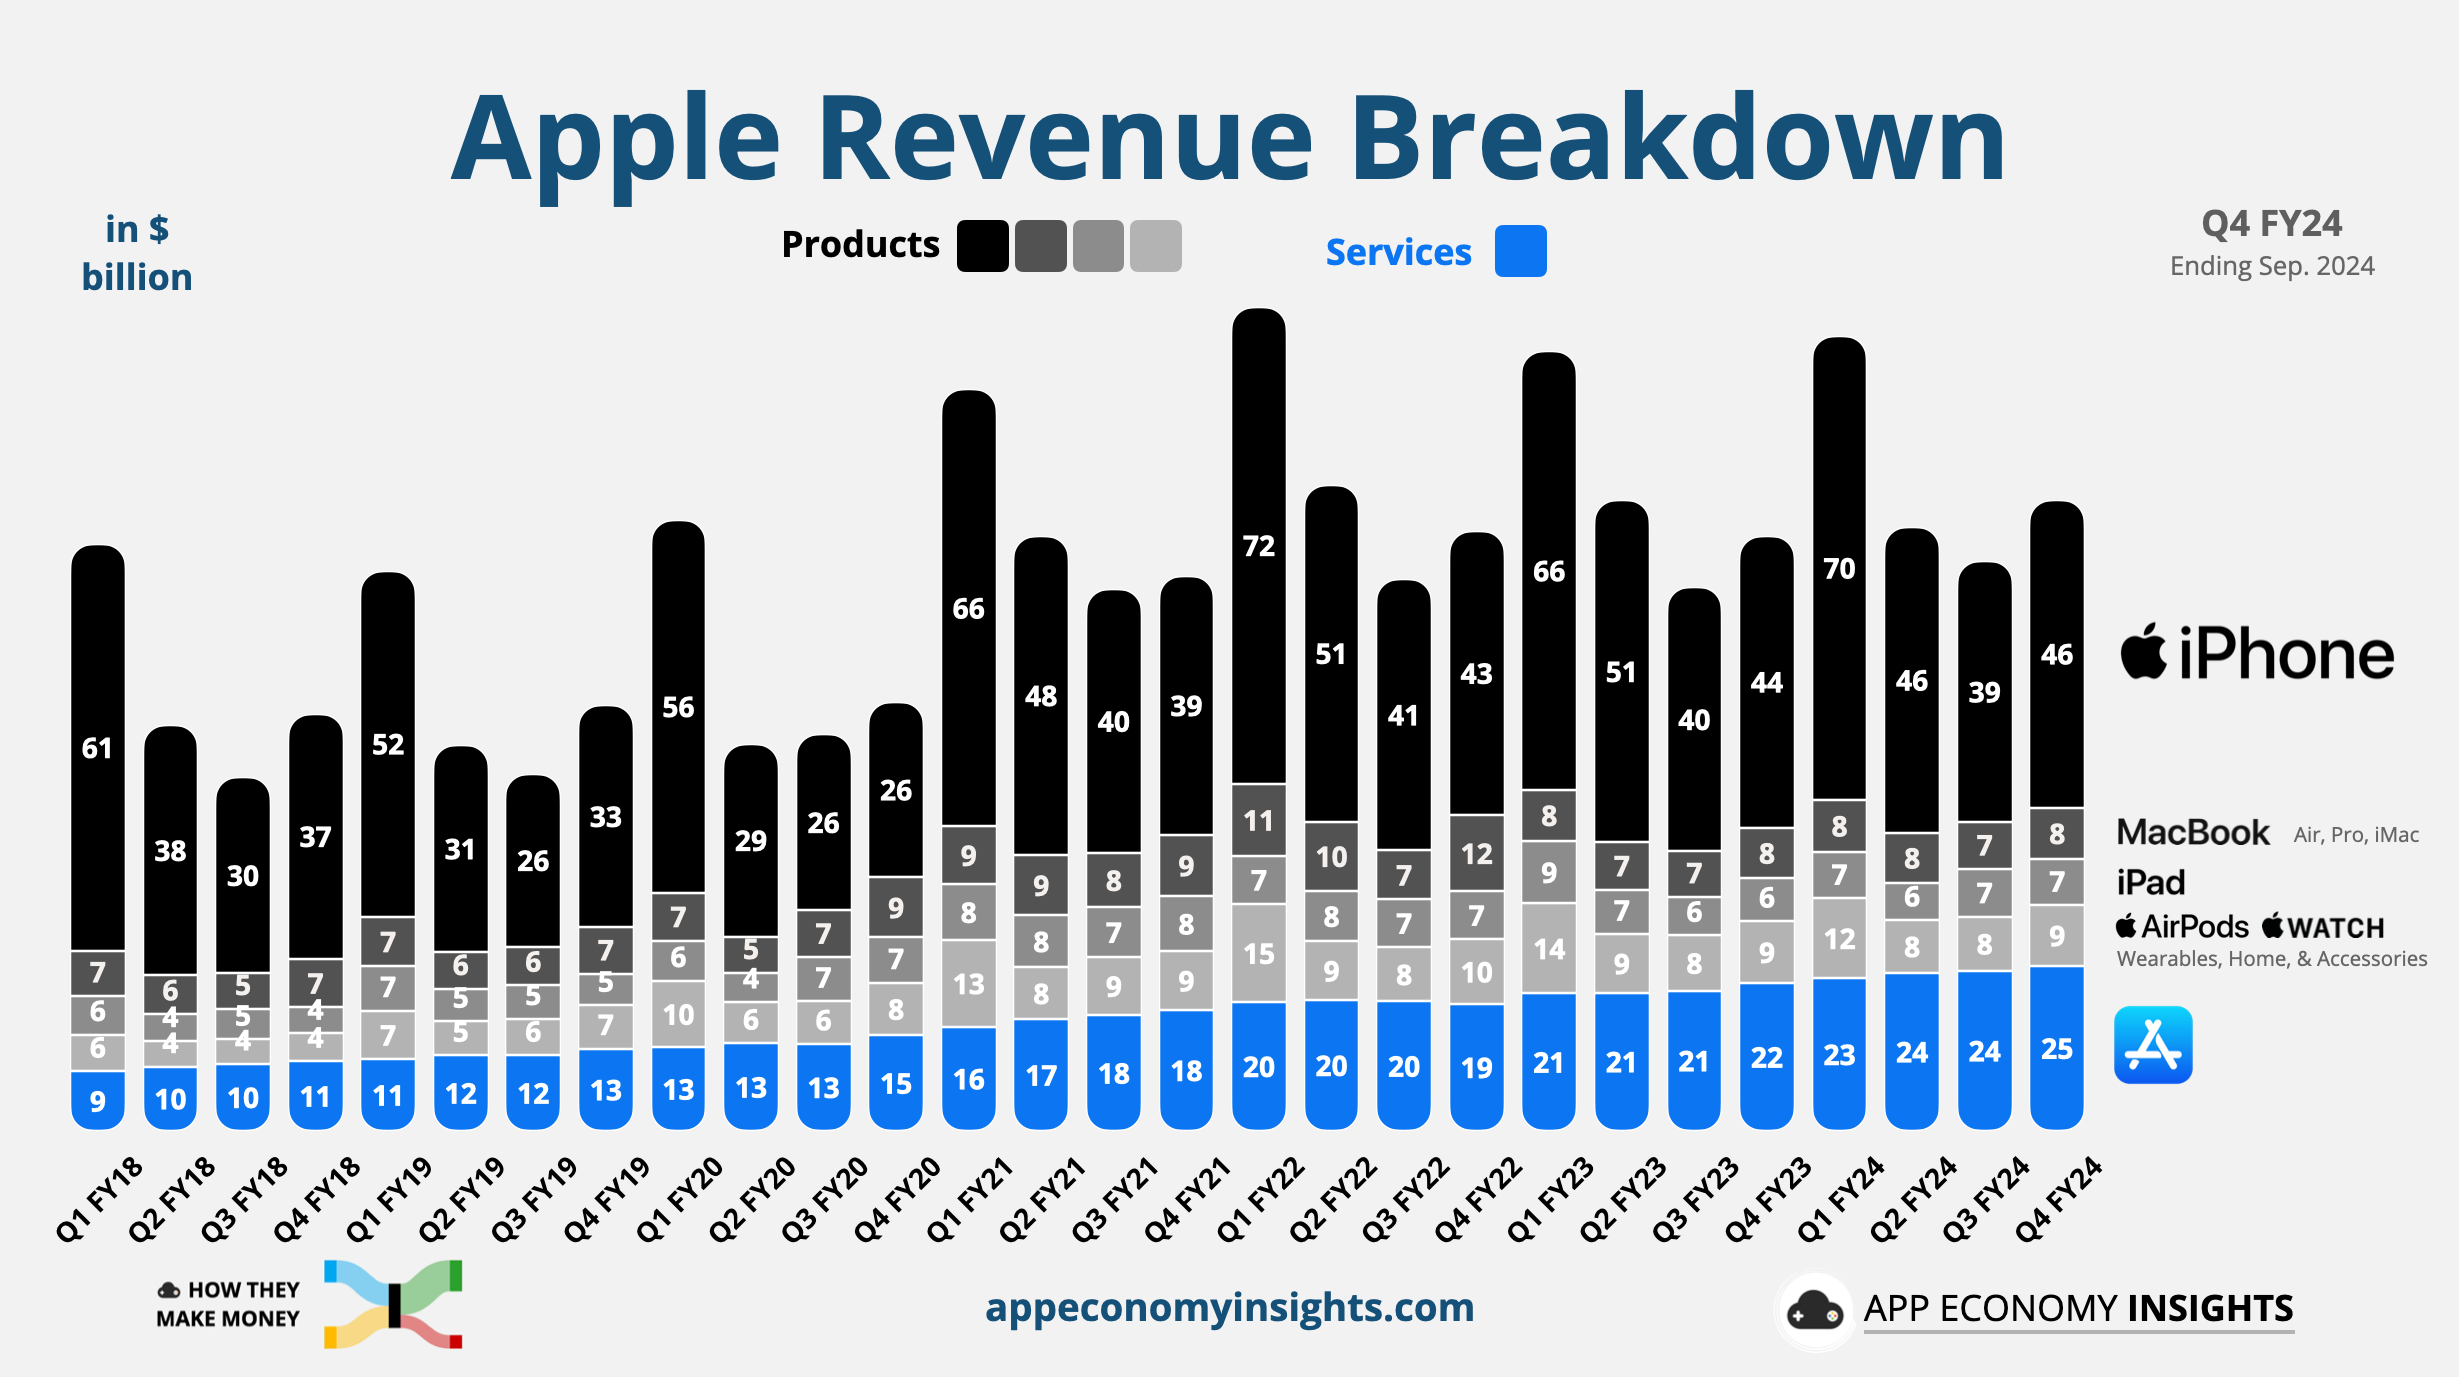
Revenue mix: Start by breaking down the company’s revenue streams. Does the business rely on a single product or service, or is it diversified across multiple offerings and geographies? For example, Apple generates revenue from products (phones, tablets, computers, wearables) and services (software, traffic acquisition, payment fees). A diversified revenue mix often means more stability, while dependency on one source could be a red flag. High customer concentration can indicate a higher risk of disruption if the market turns.
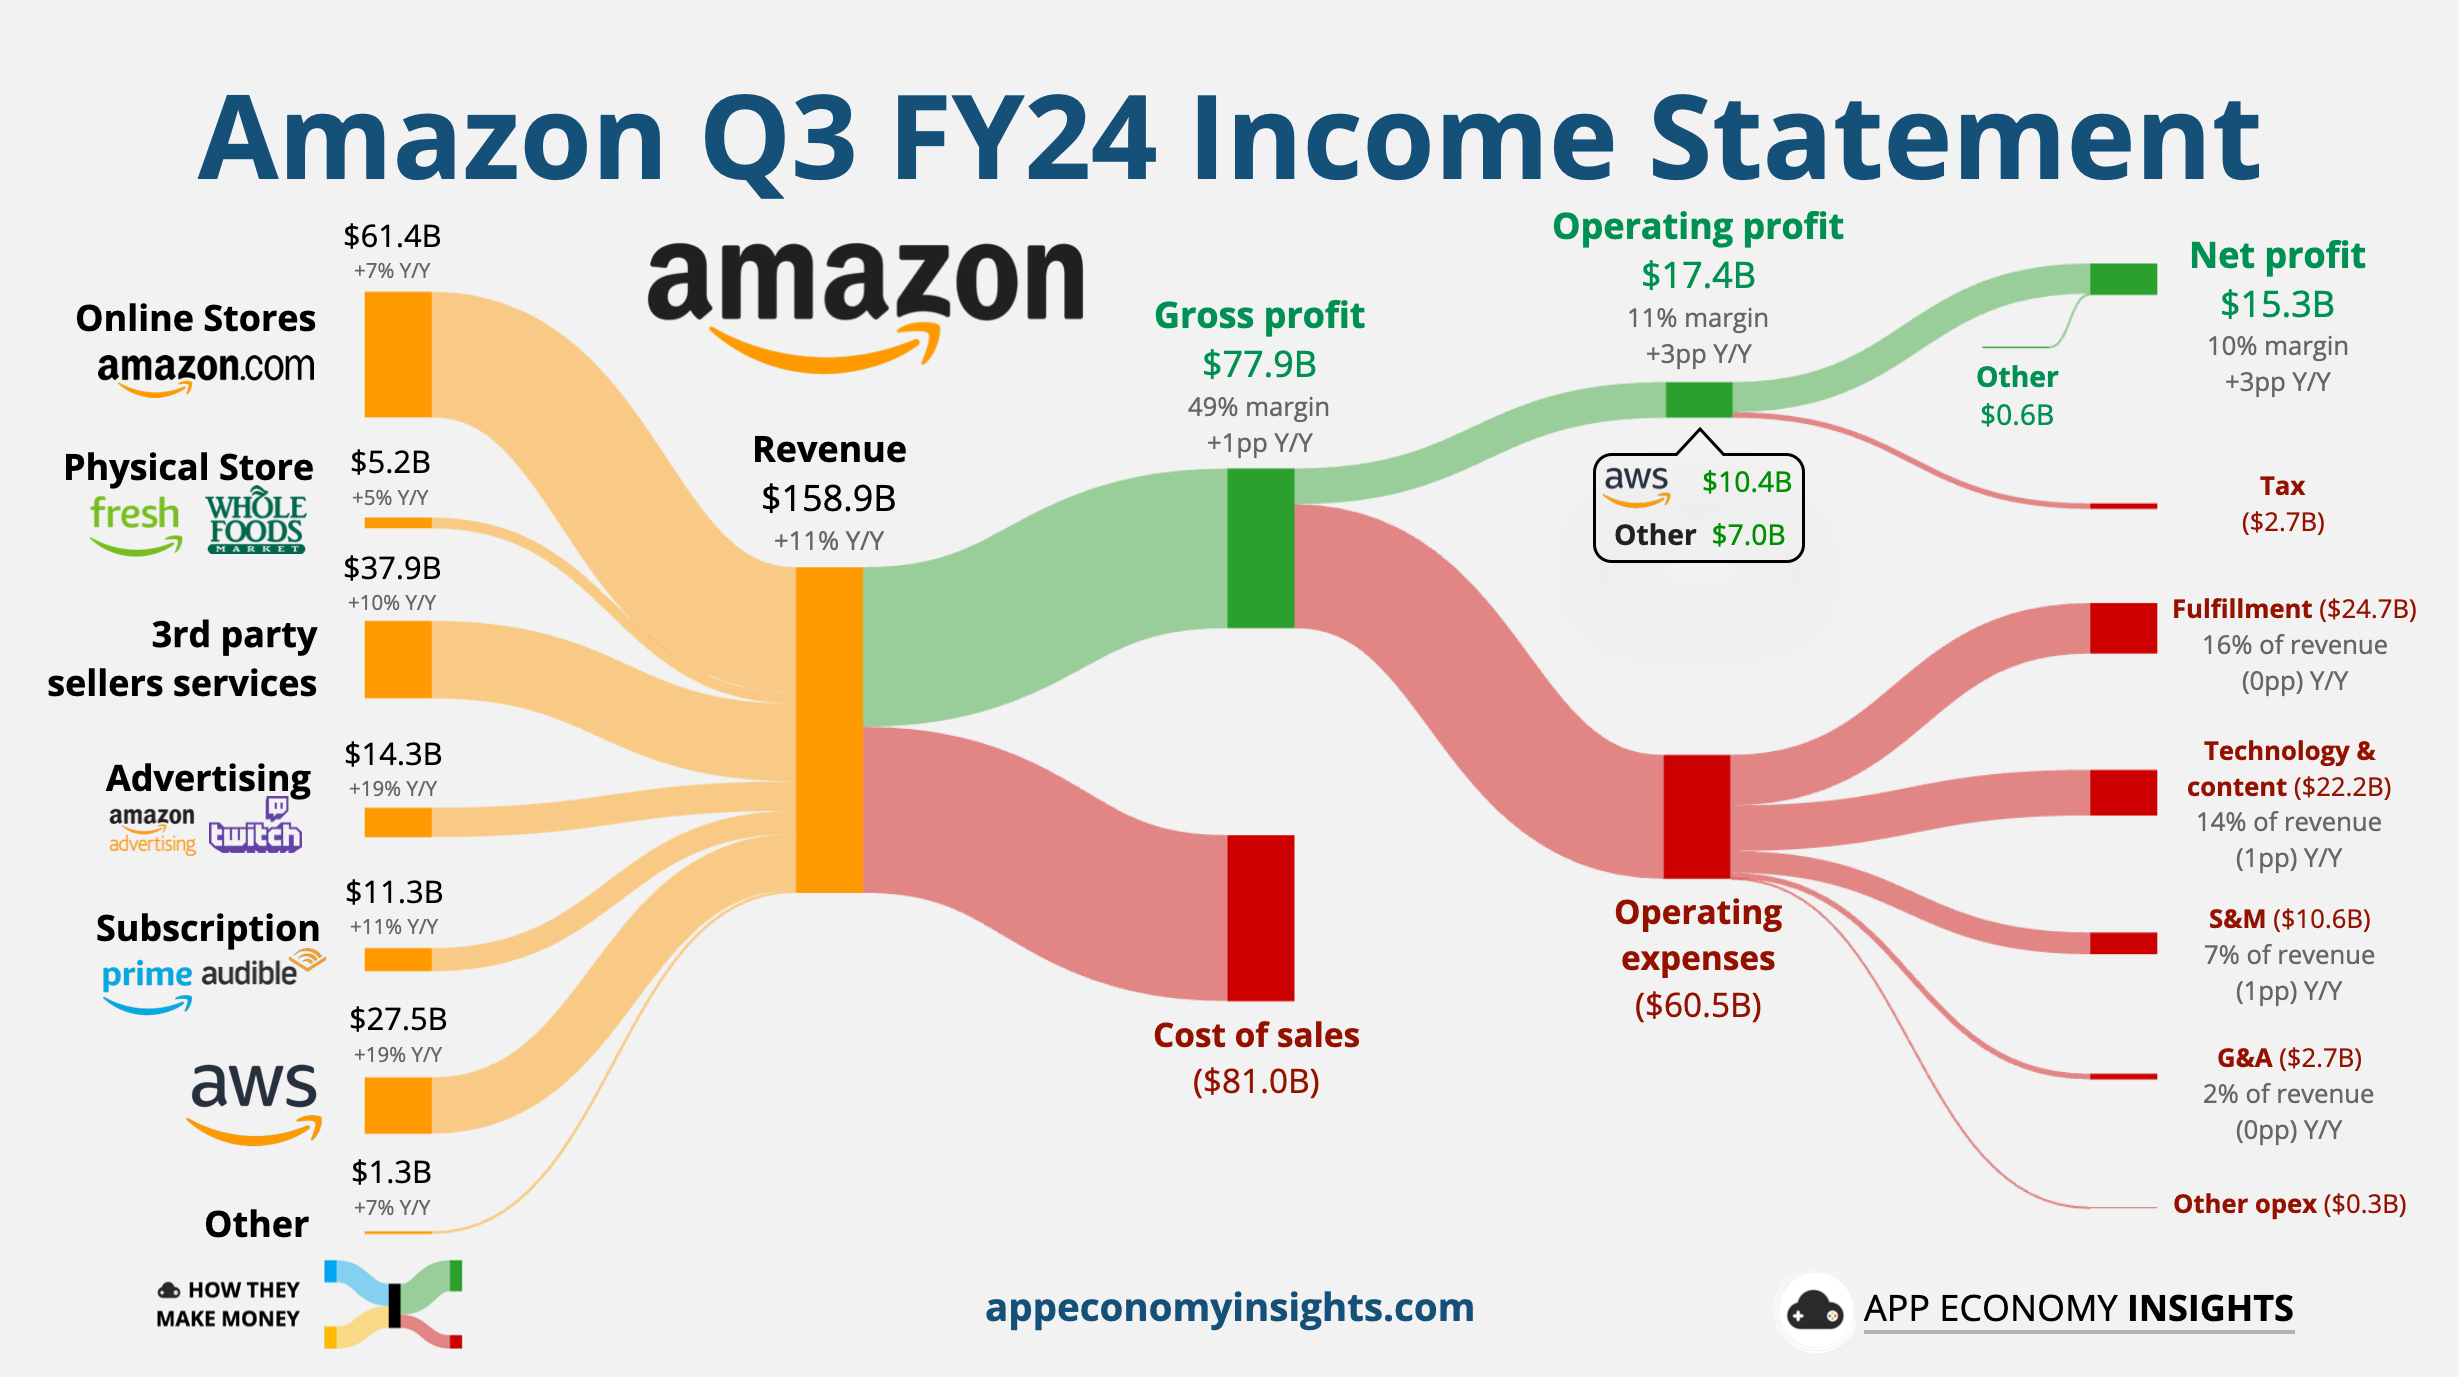
Unit economics: Dig deeper into the building blocks of profitability. The gross margin shows how much is left after the company delivers its product or service. Look for signs of scalability—do margins improve as the business grows? Where is most of the profit coming from? For example, 60% of Amazon’s operating profit comes from its cloud infrastructure service, AWS. Analyzing the operating margin by segment can help see what drives the company’s success and focus on what matters.
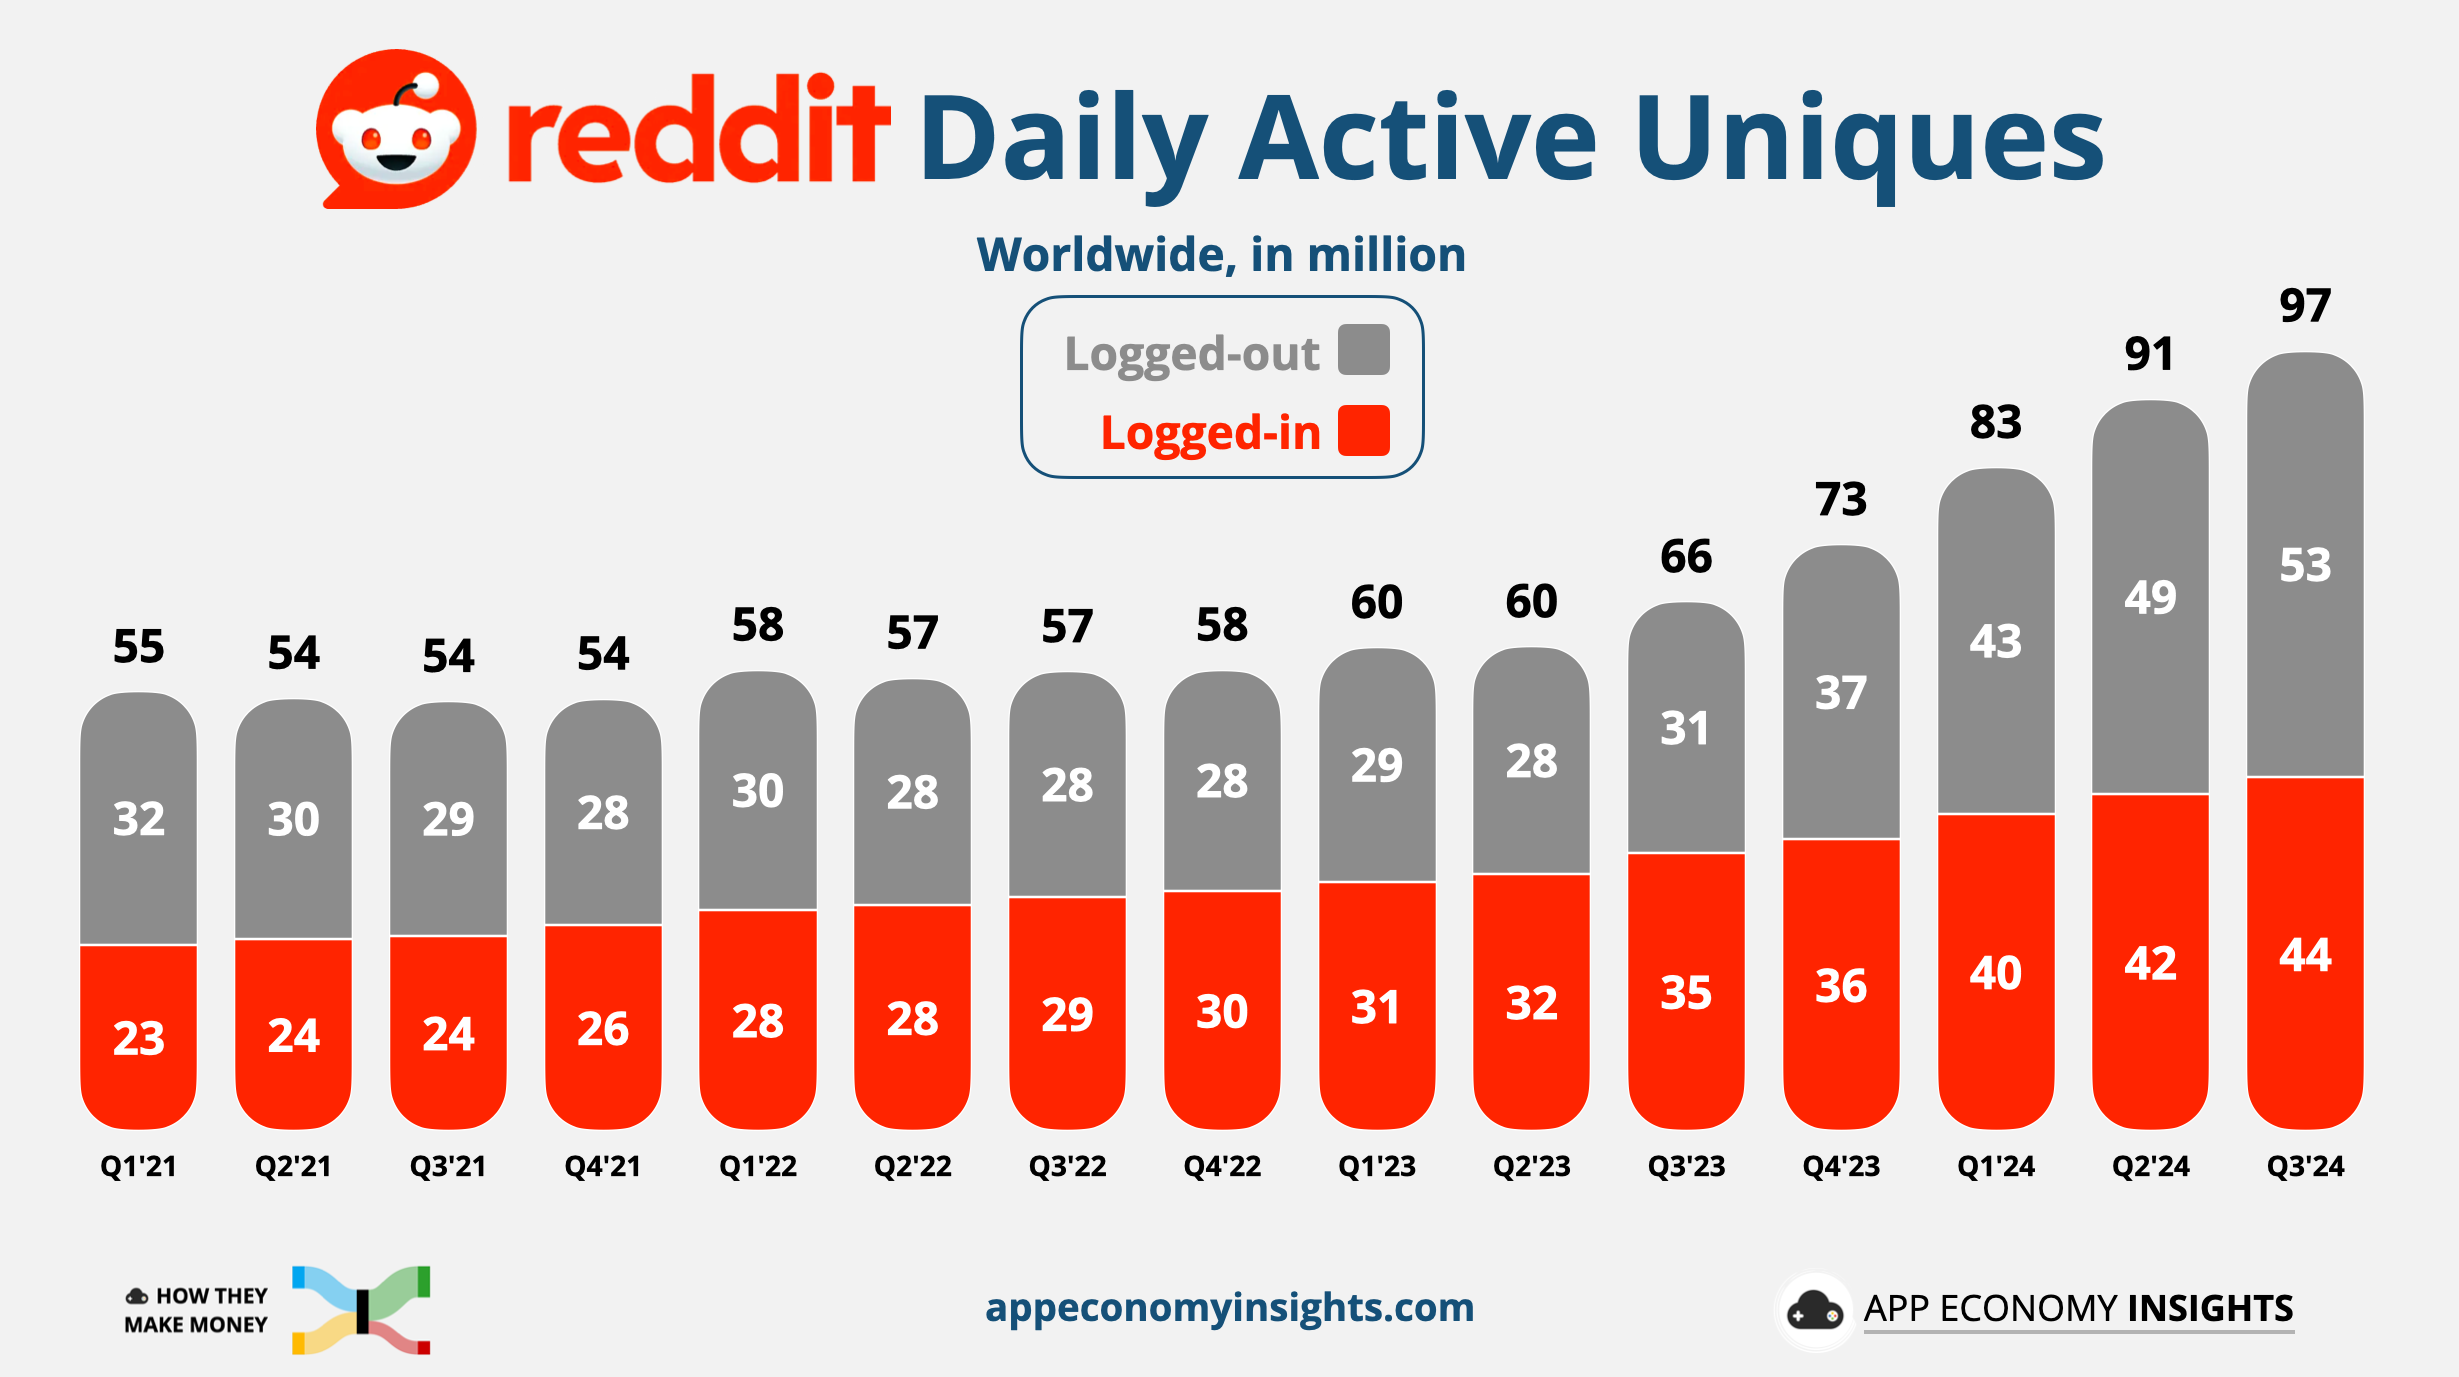
Key metrics: Not all metrics are born equal. For e-commerce, gross merchandise value (GMV) and take rate might be key drivers. For subscription-based businesses, annual recurring revenue (ARR) and retention could tell the story. Always identify the one or two metrics that best reflect the company’s momentum. If you’re unsure, management commentary in earnings reports often highlights what matters most. Pay attention to the trend over several quarters and years. Always gain context around sudden changes in trends. For example, Reddit saw a resurgence in user growth after its API pricing change and third-party app shutdown in July 2023, followed by a boost from machine translation recently.
3. What could go right?
Market growth: A rising tide lifts all boats. If the company operates in a growing industry, it benefits from tailwinds even without being the market leader. Look for secular trends like e-commerce, streaming, renewable energy, or AI adoption. Is the company positioned to ride this wave? Is the market fragmented or winner-takes most?
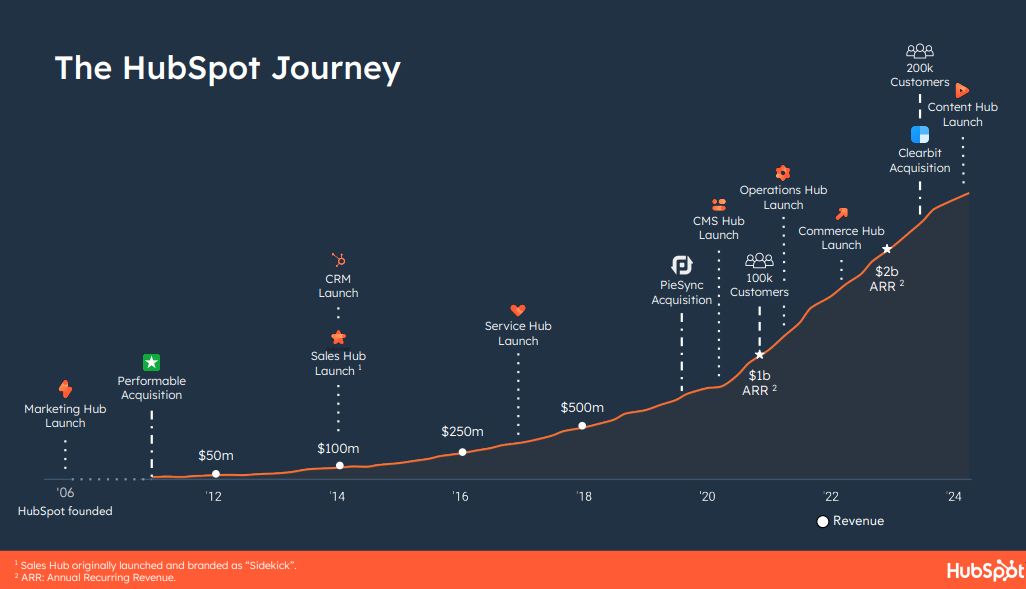
New products and innovation: Innovation keeps a business relevant. New products or services can unlock growth, enter untapped markets, or deepen customer loyalty. A history of new product releases that delight customers and expand the addressable market is extremely valuable. After all, if you invest for the next decade, it’s often impossible to know what will be the growth catalyst a few years from now. Look for signs of ongoing R&D investment and management’s focus on staying ahead of the curve. For example, HubSpot launched its web Content Management Software (CMS) nearly 14 years after being founded, and it has become a clear leader in this field. It’s not all that surprising if you look at their history of product releases.
Moat expansion: A strong competitive advantage—or “moat”—can protect a company from rivals. It could be a powerful brand, network effects, proprietary technology, or cost leadership. The question is: Can the company widen its moat over time? For example, Tesla’s early lead in EVs expanded as it scaled production, reduced costs, and became the charging standard. Every quarterly report demonstrates the state of a company’s competitive advantages.
4. What could go wrong?
Market disruption: Even the strongest industries can experience upheaval. Emerging technologies, regulatory changes, or shifting consumer preferences can render business models obsolete. Consider how streaming disrupted cable TV or how ride-sharing disrupted taxis. Ask yourself: Is this company prepared for sudden changes in its market? Can it adapt to ride a new wave like Apple did with the iPhone in 2007?
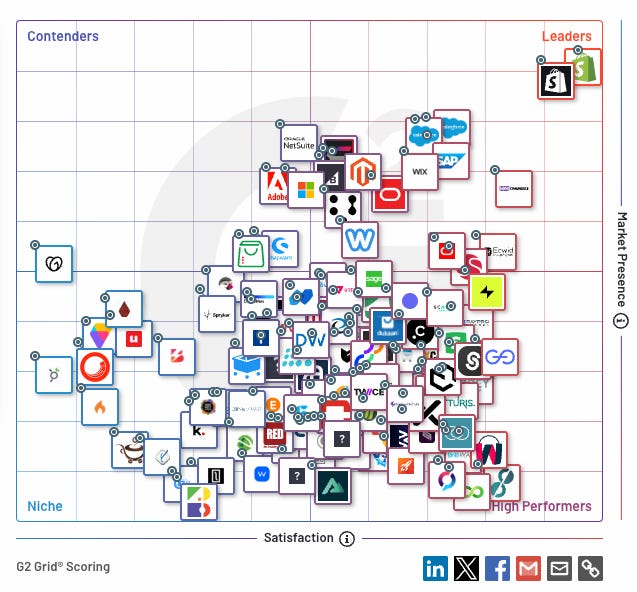
Competition: Every company faces rivals, but some industries are more cutthroat than others. Competitors with deeper pockets, better technology, or stronger brands can erode market share. Watch out for price wars, declining margins, or signs that rivals are gaining ground faster. Competition is unavoidable. What matters is how superior a product is. Market intelligence firms like Gartner, Forrester, or G2 offer excellent competitive benchmarks for software businesses. Consumer reviews, testimonials, and Net Promoter Scores (NPS) can indicate the reputation of a business.
Moat erosion: A shrinking moat is a big red flag. A brand can lose its luster, a patent can expire, or customer loyalty can fade. Consider how vulnerable the company’s competitive advantage is to being copied, bypassed, or outspent. For example, declining revenue per customer can indicate a fading pricing power. Worsening retention metrics can be a sign of competitive pressure. A great place to find an overview of a company’s risks is its latest 10-K filing.
5. What do the numbers say?
Profitability: The income statement, also called profit and loss statement (P&L), reveals whether the company makes money and how efficiently. Key metrics to watch: revenue growth (assessing demand), gross margin (how much the company keeps after production costs), operating margin (after overhead), and net income (the bottom line after taxes and any other non-operational costs). Look for consistent growth and improving margins over time. Check out our guide on how to analyze an Income Statement.
Solvency: A company’s balance sheet tells you how financially stable it is. Key indicators: the debt-to-equity ratio (is the company overleveraged?), cash reserves (does it have a safety net?), and assets vs. liabilities (can it cover its obligations?). A strong balance sheet acts as a buffer during tough times. We also have a guide on what to look for in a Balance Sheet.
Liquidity: Cash is king. The cash flow statement shows whether the company generates enough cash to fund operations and growth. Free cash flow (cash left after expenses and capital investments) is particularly important, fueling dividends, buybacks, or acquisitions. Positive and consistent cash flow signals sustainability. We previously discussed how to analyze a Cash flow statement.
6. Is the price right?
Which metrics to focus on? Valuation isn’t one-size-fits-all. We cover this in detail in our ultimate guide on How to Value a Stock. It all depends on the company's growth stage. For mature companies, focus on Price-to-Earnings (P/E) or EV/EBITDA. For young companies still growing fast and losing money, Price-to-Sales (P/S) or EV/Revenue might be more relevant. Investing is about the future, not the past. So, using forward-looking valuation metrics is always better. The goal is to understand what you’re paying relative to the company’s future earnings potential. Compare these metrics to peers and the broader market to gain context on alternatives.
Investment horizon: How long do you plan to hold this stock? The longer you hold a stock, the less its exact valuation at the time of purchase matters. A premium price might be justified if the company has years of growth ahead. Does the current market cap reflect the company’s potential, or are you paying for hype? If the company matches Wall Street’s expectations over your time horizon, what will the valuation look like when you’re ready to sell?
Why is valuation the last thing to look at? Valuation is the final step for a reason. It only matters if the business has potential and financials are solid. A cheap stock with a broken business model isn’t a bargain—it’s a trap. By focusing on valuation last, you ensure you’re not lured by low prices. The correct valuation of a business losing money in perpetuity is zero. It’s easy to find cheap stocks, but we often get what we paid for.
By asking these six questions, you can break down even the most complex companies into simple, actionable insights.
Start with the underlying business: what the company does and its unit economics. Then, explore the opportunities, risks, and financials. Finally, assess whether the valuation makes sense based on your time horizon.
Now, it’s time to put this into practice. By applying this framework, you can analyze any stock and make smarter investment decisions. So, what stock are you analyzing next? Let me know in the comments!
We just added a new stock in App Economy Portfolio using this framework. It’s an enterprise software company with a market cap under $10 billion, boasting exceptional growth and retention metrics.
A year ago, the January 2024 Stock Idea was Palantir (PLTR)—up nearly 400% since then. Curious about this month's pick? Find out in the full investment thesis for the January 2025 Stock Idea.
That's it for today!
Stay healthy and invest on.
Use our visuals for your organization
Interested in licensing our visuals for a report or presentation? Are you looking for custom visuals for your business or brand? Let's collaborate! Complete the form here, and we'll get in touch.
Disclosure: I own AAPL, AMZM, CRM, HUBS, GOOG, PLTR, SHOP, and TSLA in the App Economy Portfolio. I share my ratings (BUY, SELL, or HOLD) with App Economy Portfolio members.
Author's Note (Bertrand here 👋🏼): The views and opinions expressed in this newsletter are solely my own and should not be considered financial advice or any other organization's views.
Did Nancy Pelosi buy it?