

🔎 5 Ways To Analyze Earnings
Answer these questions to separate signal from noise

Earnings season is a chance to uncover How They Make Money—and the insights that drive smart investing.
But with every headline, how do you separate Signal from Noise?
Noise is everywhere—the hype, the speculation, the distractions flooding the news cycle. Signal is the real story—the data that reveals a company’s true performance.
Quarterly reports cut through the chatter, showing what’s working and what’s not. They’re a rare look under the hood of a company’s health.
📊 A picture is worth a thousand words—so I bring insights to life visually. Dive into the key metrics and capture the big picture in seconds.
That’s why I’m delighted to offer Premium at just $89 (normally $119).
It’s our lowest price ever. But don’t wait! This offer ends on Wednesday.
That’s a whole year of Premium research and thousands of visuals, including:
✅ 2 weekly articles packed with insights.
✅ Monthly reports covering 200+ companies.
✅ Full access to our library of Premium articles.
How exactly do I analyze earnings reports? 🤔
Let’s walk through key indicators.

1. Revenue Trends
Follow the Money.
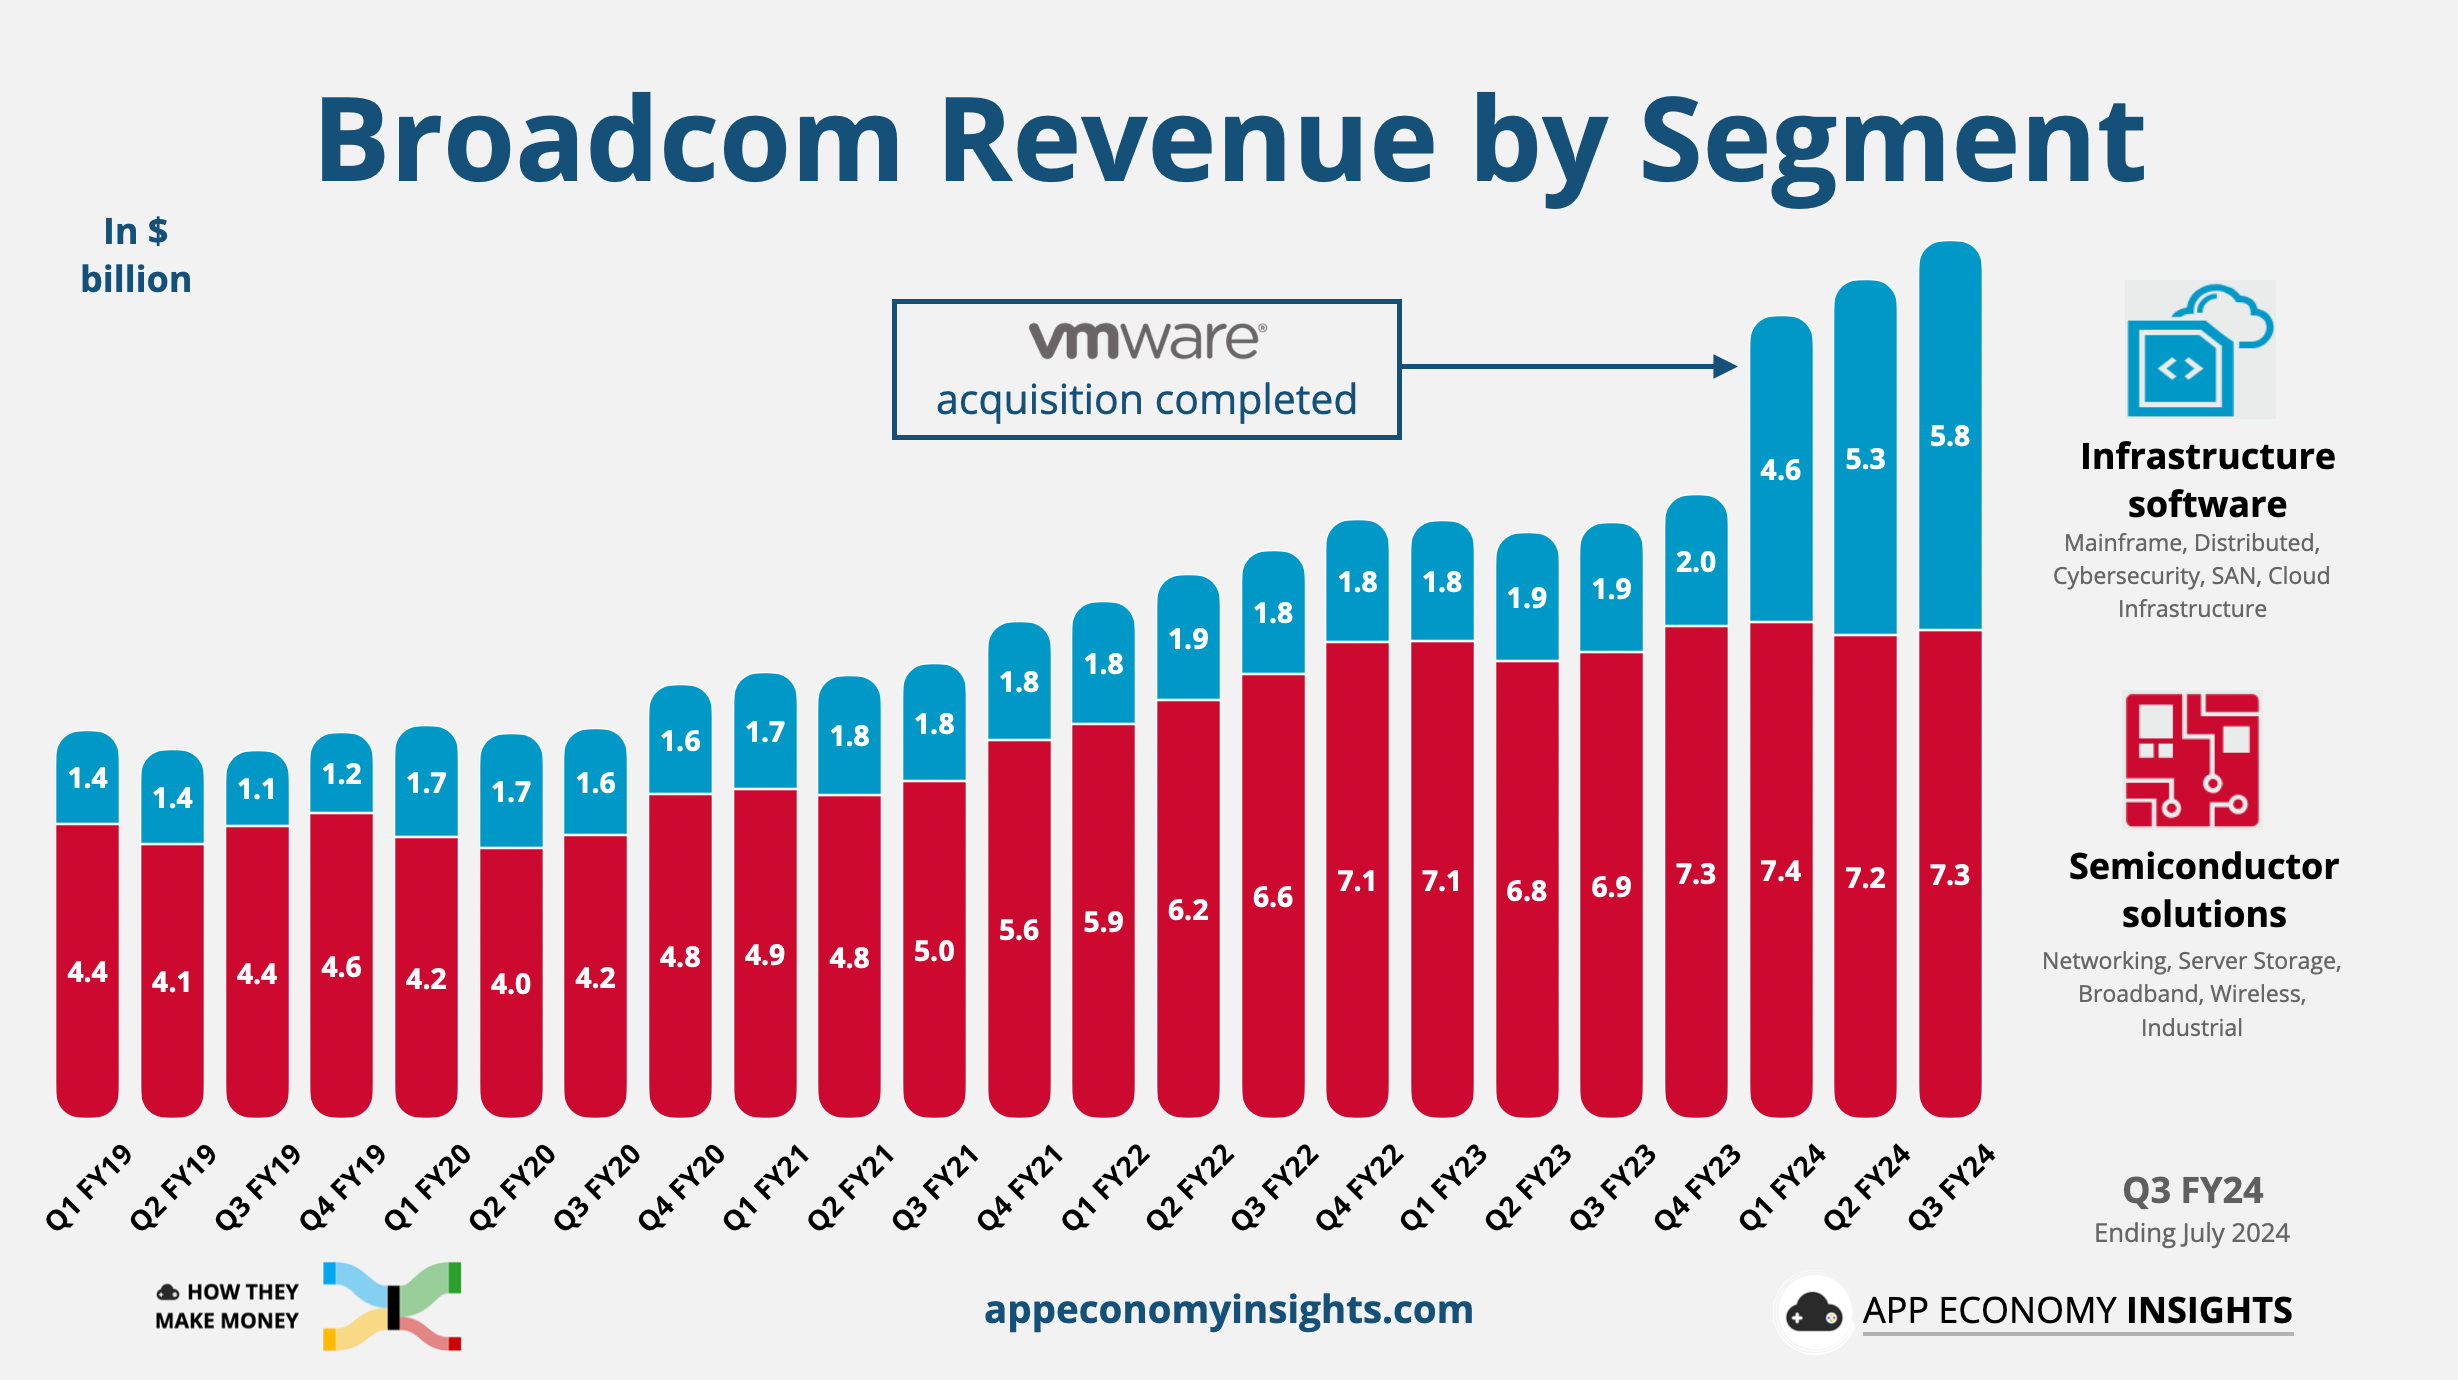
Revenue reveals whether demand is growing or shrinking. Rising revenue often signals a product or service is in demand, potentially gaining market share. It’s the heartbeat of a business, with its growth trajectory defining long-term potential.
Look closer—Is the growth organic? What key segments are driving it? For example, Broadcom’s recent growth came from its VMware acquisition.
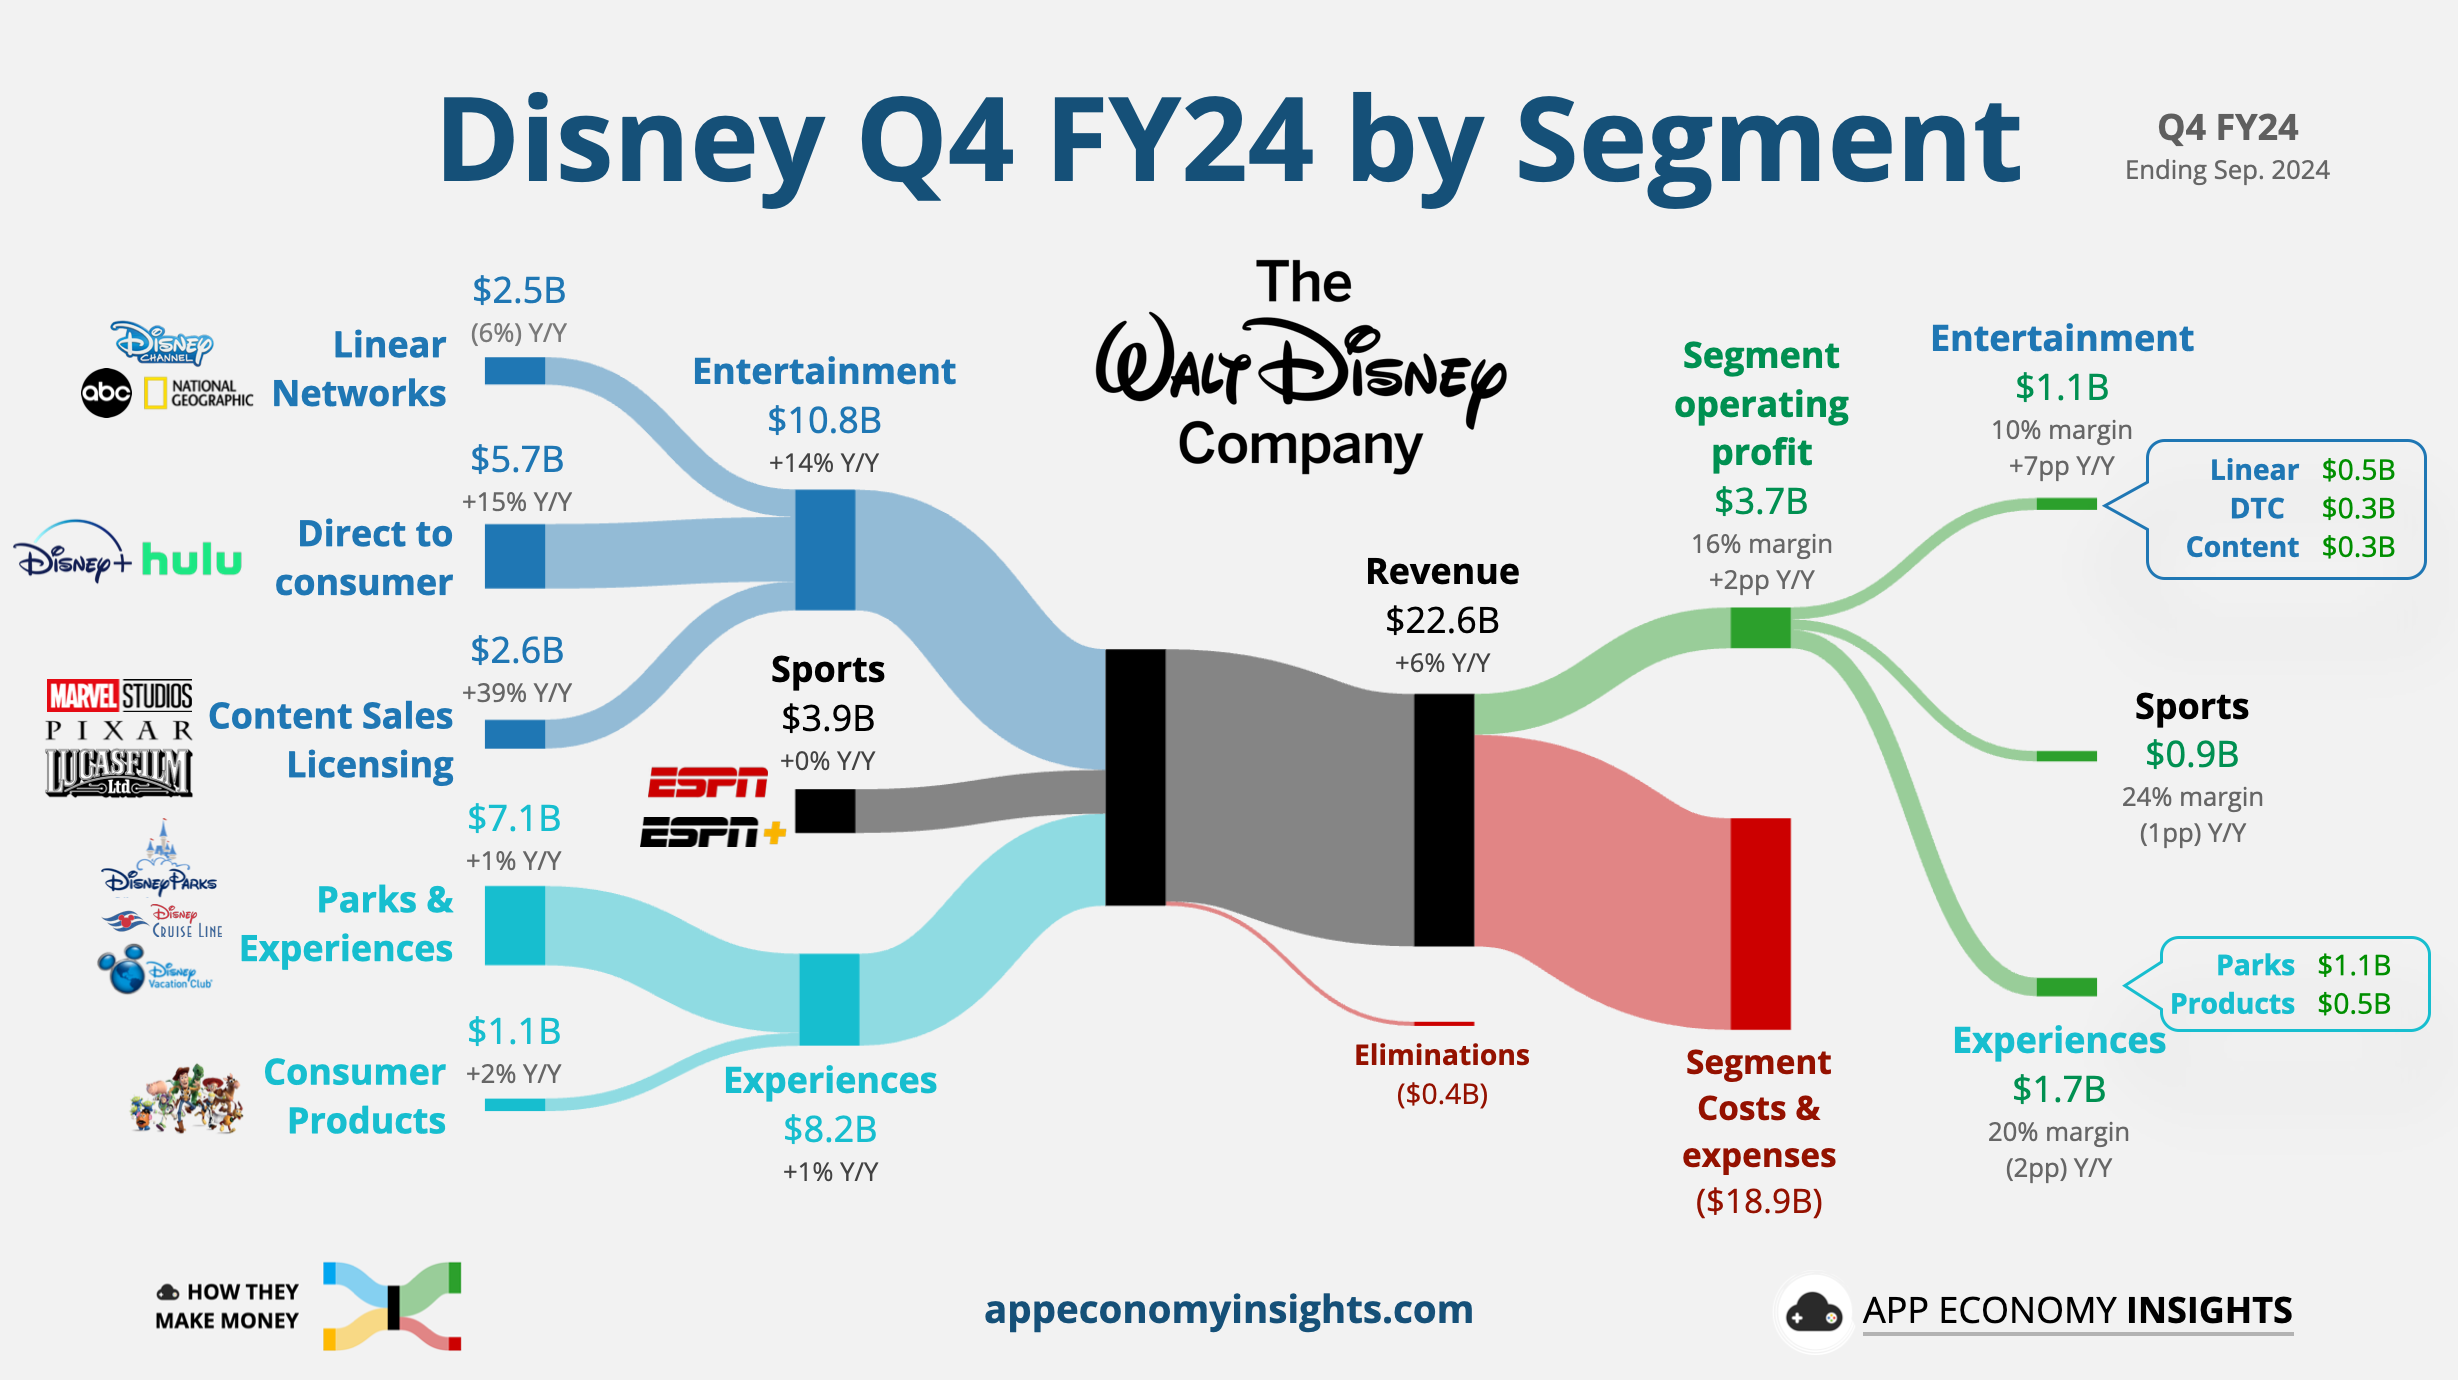
Conflicting stories can emerge. For example, Disney’s Direct-to-Consumer strategy eats away at its legacy Linear Networks.
2. Profitability
More Than Just Sales.
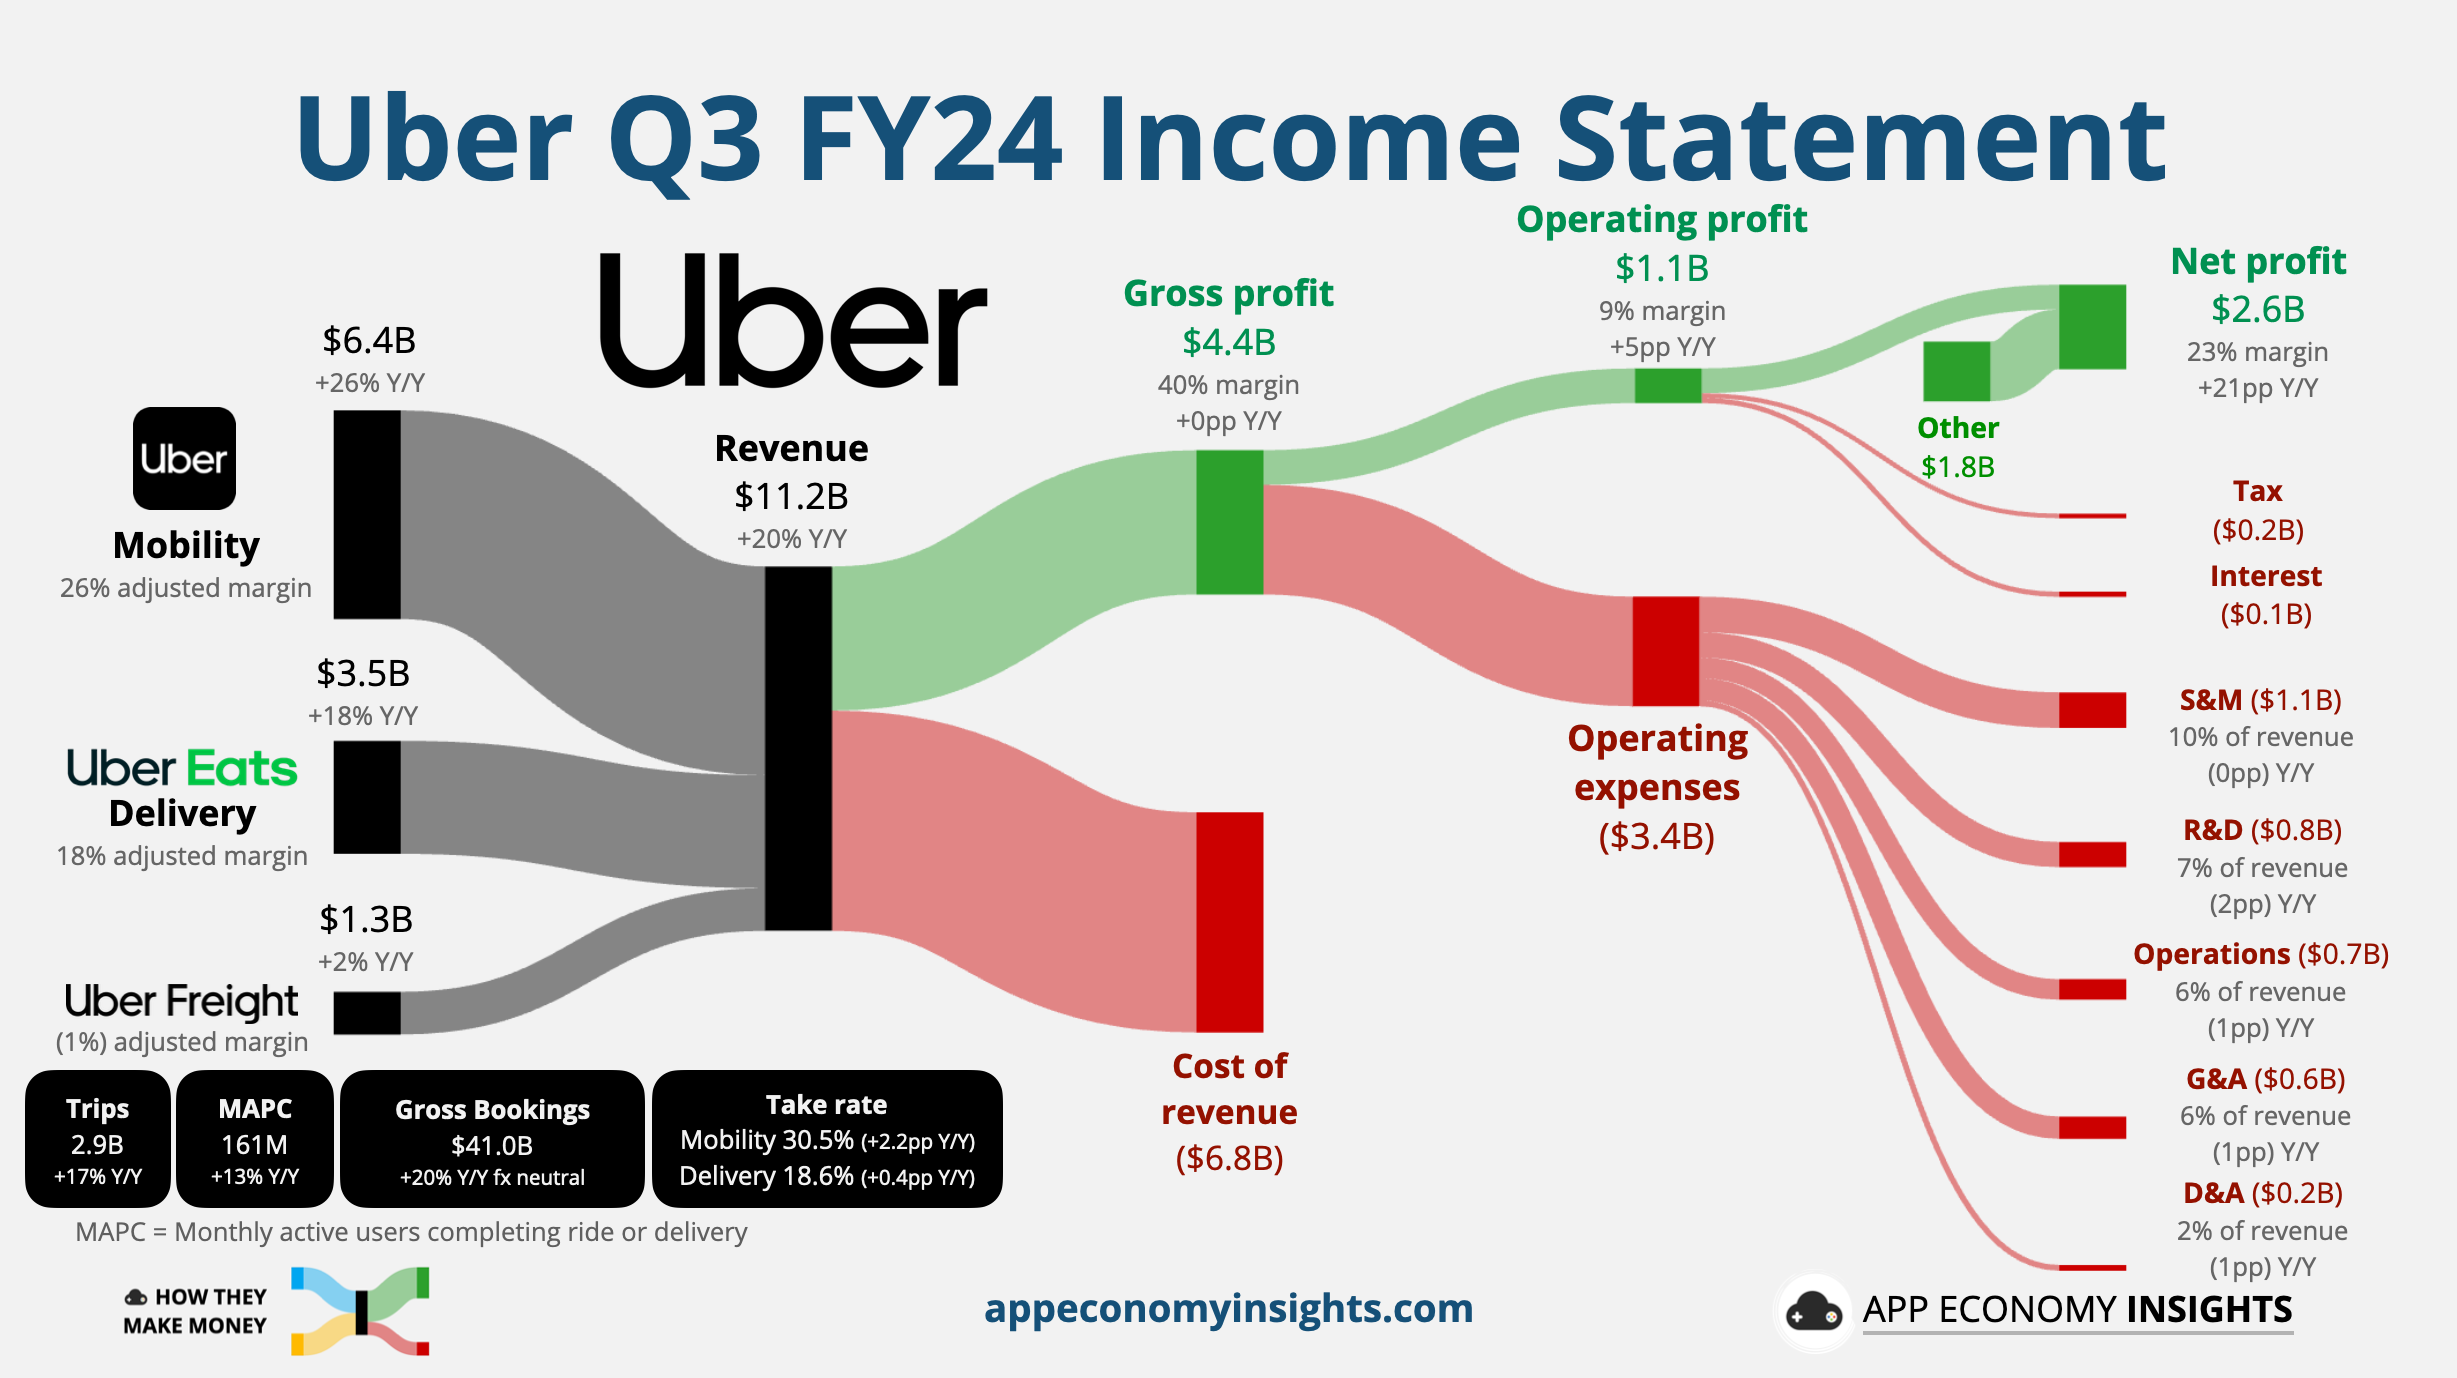
Margins show how well a company converts revenue into profit. High profit margins indicate resilience, with companies better able to manage unforeseen events. Where is the money going? Is growth funded by marketing? Or by reinvestment in the product? Can the company sustain profitable growth and reward investors? Margin trends reveal a business’s efficiency. For example, Uber steadily improved its profitability last year—a trend we covered in depth.
It’s critical to compare businesses against relevant peers. Premium members get access to industry comparisons with detailed round-ups. Check out some of our past research:
3. Liquidity & Solvency
The Cash Cushion.
Liquidity shows if a company can meet short-term obligations, while solvency reflects its long-term health and ability to weather storms. For example, Apple generated $110 billion in operating cash flow in FY23, returning much of it to shareholders through buybacks and dividends.

4. Customer Metrics
Acquisition. Retention. Monetization.
Unit economics involve a trifecta critical to long-term success:
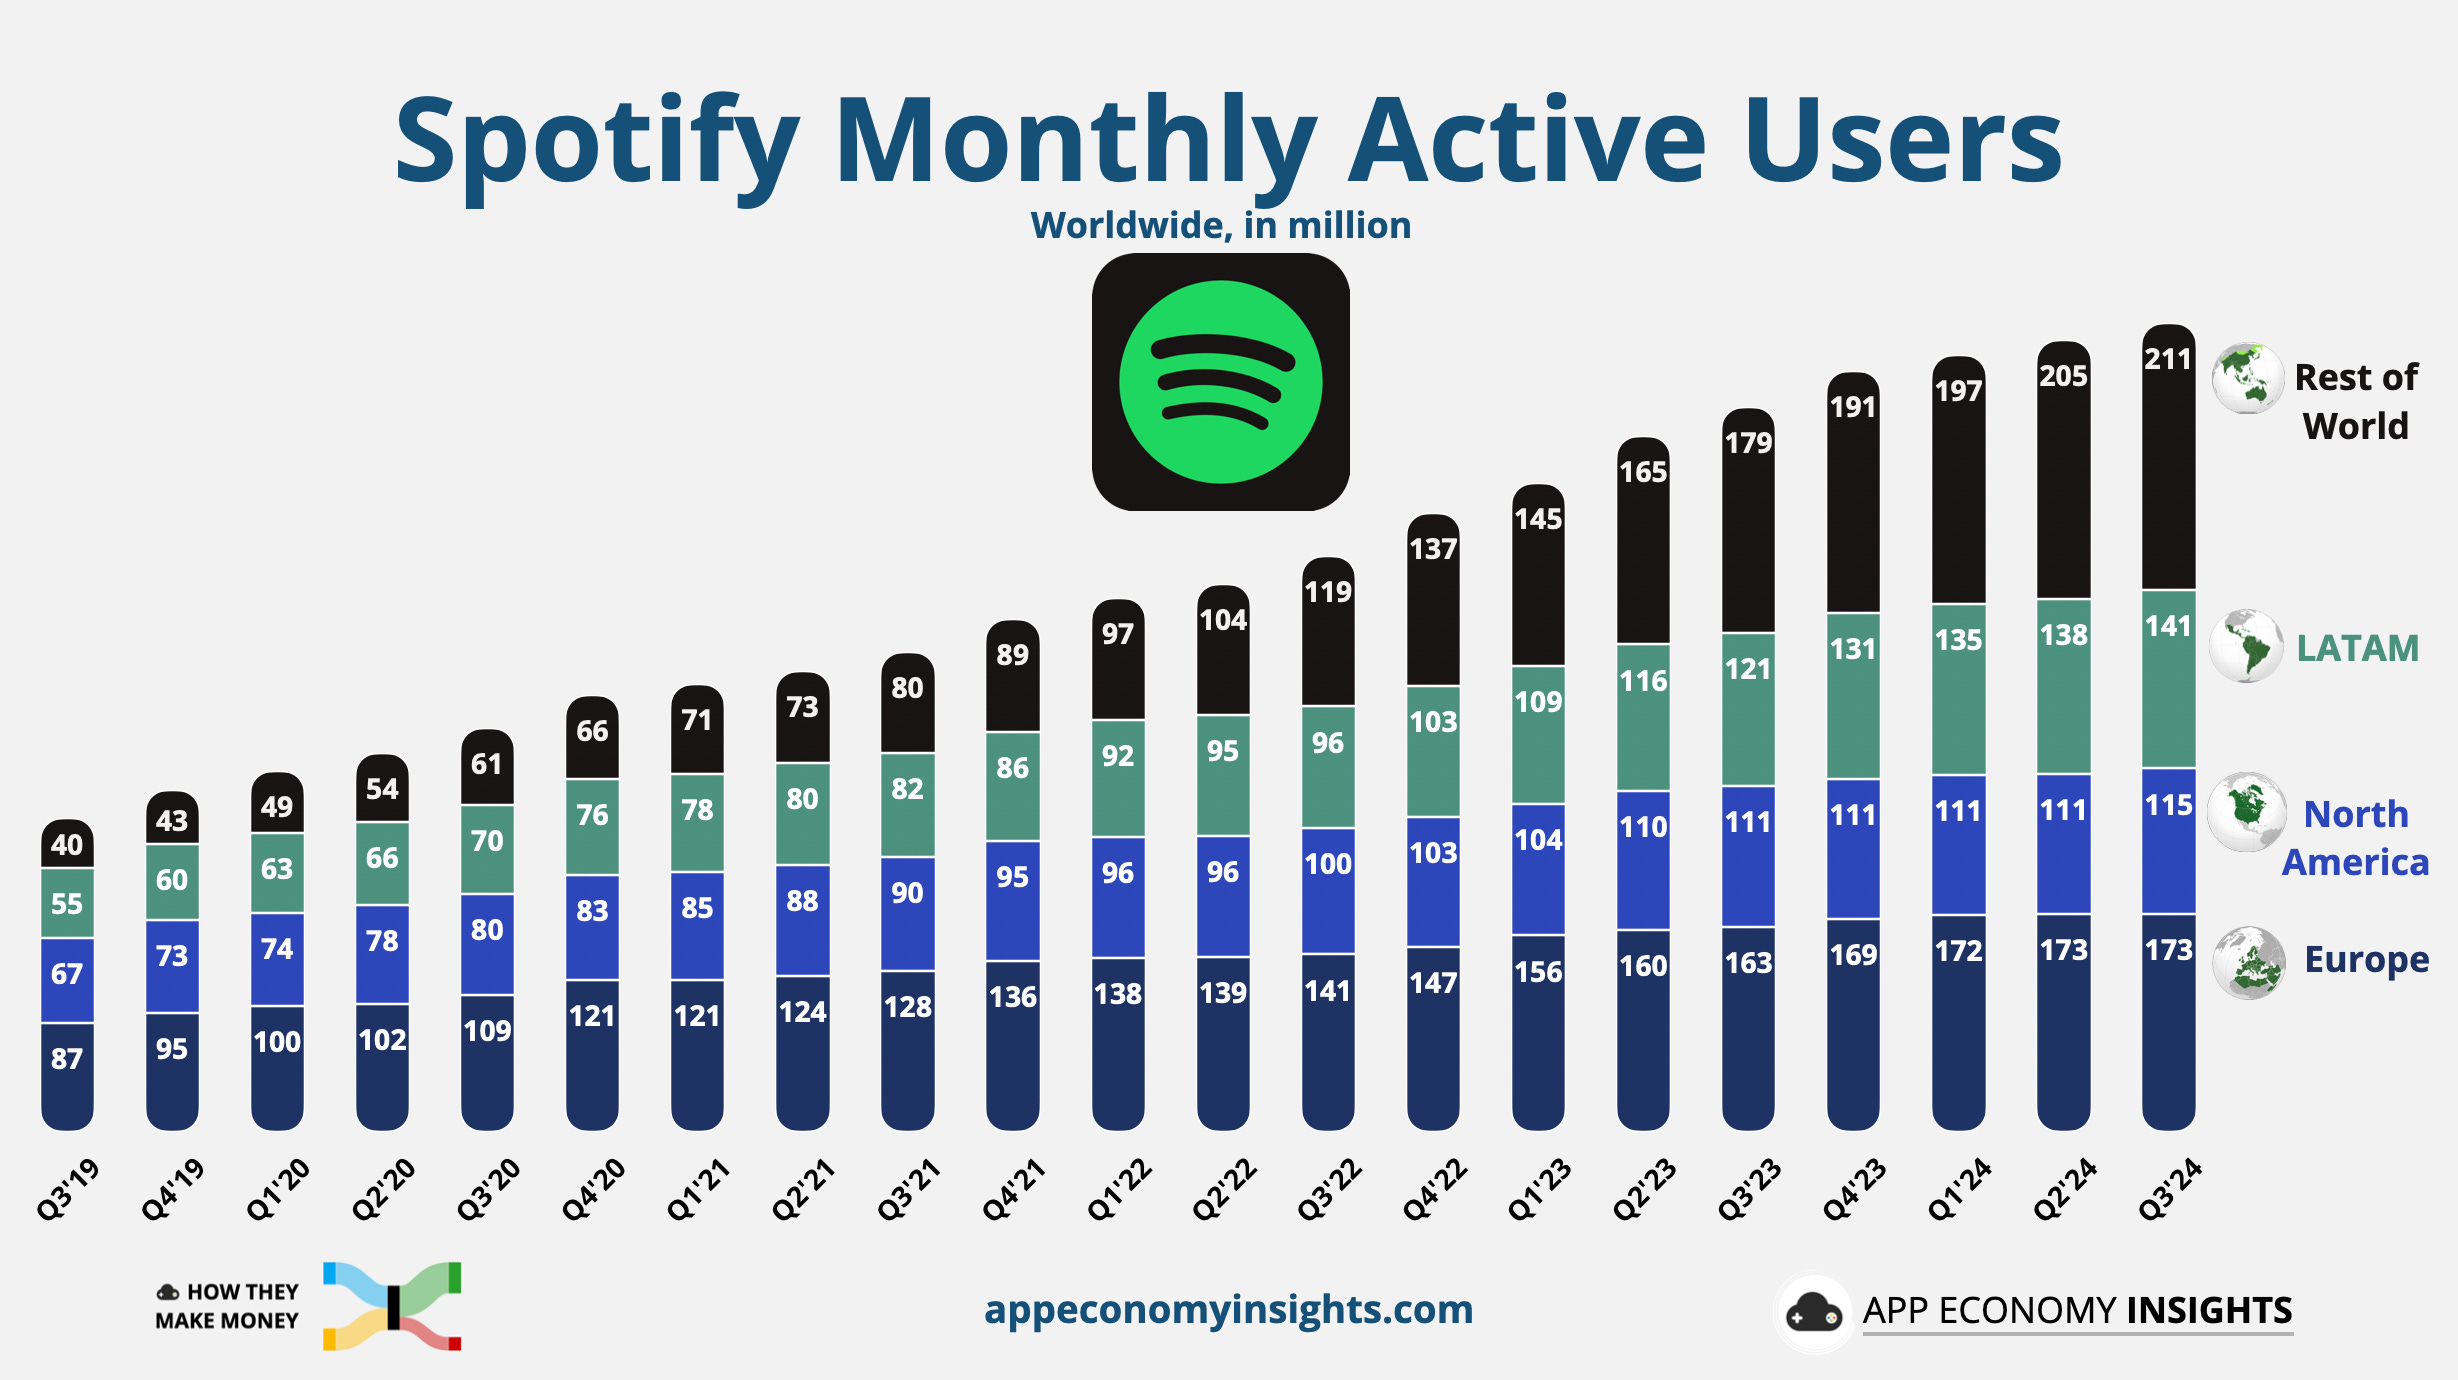
Acquisition: Customer growth fuels revenue. How much does it cost to get a new customer? Is it sustainable and repeatable? For example, Spotify’s recent user growth was driven by markets with limited monetization potential, raising questions about near-term growth after a series of price hikes in mature markets.
Retention: Possibly the most important. Dollar-based retention and churn rates shed light on customer demand and loyalty. It’s the foundation for a business that can stand the test of time.
Monetization: Growth in revenue per customer can indicate an ability to upsell and cross-sell, or demonstrate the pricing power of the business.
5. Outlook
The Road Ahead.
Investing is about the future, not the past. Management’s guidance reflects expectations and confidence in the path forward. A raised outlook signals optimism, while a lowered one can be a red flag. Investors pay close attention to guidance because stock prices are forward-looking, based on future earnings’ potential. A positive outlook sparks interest, while caution invites closer scrutiny. Weak full-year guidance can overshadow even the strongest quarterly results.
Analyzing companies takes time, but powerful visuals cut through the noise. Each chart tells a story, turning complex data into actionable insights.
Save time and make smarter decisions. Get Premium today to track 200+ companies with ease and stay ahead of the market.
Stay healthy and invest on!
Bertrand
P.S. This Black Friday offer ends in ⏰ 4 days ⏰ Lock in the lowest price ever—just $89 for a full year of Premium insights. 👉 Click here to secure the offer now