🚦 Uber Joins the S&P 500
A look at memberships, autonomy, and a comparison to Lyft
Greetings from San Francisco! 👋
A warm welcome to the recent additions to our community!
Over 68,000 How They Make Money subscribers turn to us weekly for business and investment insights. Glad you're here.
🗓️ The year is almost over!
Soon, we’ll look back at the business highlights that shaped 2023.
Make sure you vote below 🗳️ and stay tuned for the final results!
Uber just earned a coveted spot in the S&P 500.
For US companies, entering this prestigious index is a rite of passage, implying robust financial health and the trust of institutional investors.
The ride-sharing and delivery giant is having a moment after turning profitable for the first time earlier this year. While the stock has traded sideways since its 2019 IPO, it’s up over 150% in 2023.
In case you missed it, we break down Uber's transformation, from its controversial inception to its recent turnaround on our YouTube Channel.
In this issue, we’ll examine how Uber’s metrics recently accelerated across the board while improving profitability. We’ll also look at how it stacks up against Lyft.
Today at a glance:
Uber Q3 FY23.
Highlights: Memberships and Lyft.
Earnings call: Driver network and new verticals.
What to watch looking forward: Advertising and Autonomy
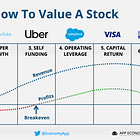
As discussed last quarter, gaining context on a business lifecycle is crucial.
Uber is in the self-funding phase. Barely profitable, reinvesting for growth and fine-tuning its business model. You shouldn't expect aggressive stock buybacks or dividend payouts at this point
Uber connects:
🙋♀️ Riders with Drivers 🚗.
😋 Eaters with Couriers 🛵.
→ Riders/Eaters are the end users of the service.
→ Drivers/Couriers earn a living on the platform.
→ Businesses of all sizes advertise on the platform.
Before we start, let me remind you of how Uber makes money:
Gross Bookings represent the total dollar value spent by end users on Uber apps (excluding tips), which indicates the platform's scale.
Take rate is a percentage % of Gross Bookings Uber keeps for facilitating the connection between end users and Drivers/Couriers.
Revenue is Uber’s take rate multiplied by Gross Bookings.
There are three main segments:
🚗 Mobility: Ridesharing.
51% of overall gross bookings.
28% take rate.
🛵 Delivery: Pickup or delivery of food, grocery, and more.
46% of overall gross bookings.
18% take rate.
🚚 Freight: Logistics, connecting carriers with shippers.
4% of overall gross bookings.
Uber’s revenue is already net of Driver and Merchant earnings, and the take rate can fluctuate based on incentives (for drivers) or discounts (for users).
Let’s look at the most recent quarter!


