


Welcome to the Premium edition of How They Make Money.
Over 300,000 subscribers turn to us for business and investment insights.
In case you missed it:

A new earnings season is here, with the big banks kicking us off.
Later this week, we’ll have a look at TSMC and ASML for our first signals from the AI infrastructure boom.
AI is already making waves in banking. JPMorgan CEO Jamie Dimon warned today about letting AI agents access customer accounts:
“If people are using them, they should understand the risk. […] We’re not going to allow just any outside agent to come in inside the company because that’s just too risky for clients and for JPMorgan.”
The concern goes beyond security. AI agents could eventually help consumers move their money between banks, threatening the cheap deposits that underpin their profitability. Wells Fargo CEO Charlie Scharf dismissed fears of an imminent disruption as “completely overdone.”
Four banking giants just reported $32 billion in combined quarterly profits this morning. Trading momentum is becoming uneven, but lending growth and resilient consumers continue to support earnings.
Let’s break down the results.
Today at a glance:
JPMorganChase: Lending Takes the Lead
Goldman Sachs: Equities Steal the Show
Wells Fargo: Bigger Isn't Better Yet
Citigroup: Turnaround Gains Ground

💯 Free 35-page report: How To Find 100-Baggers
Did you miss it? I put together a guide to finding quality stocks with 100x potential.
The Big Picture
As a reminder, banks make money through two main revenue streams:
💵 Net Interest Income (NII): The difference between interest earned on loans (like mortgages) and interest paid to depositors (like savings accounts). It’s the primary source of income for many banks and depends on interest rates.
👔 Noninterest Income: The revenue from services unrelated to interest. It includes fees (like ATM charges), advisory services, and trading revenue. Banks relying more on noninterest income are less affected by interest rate changes.
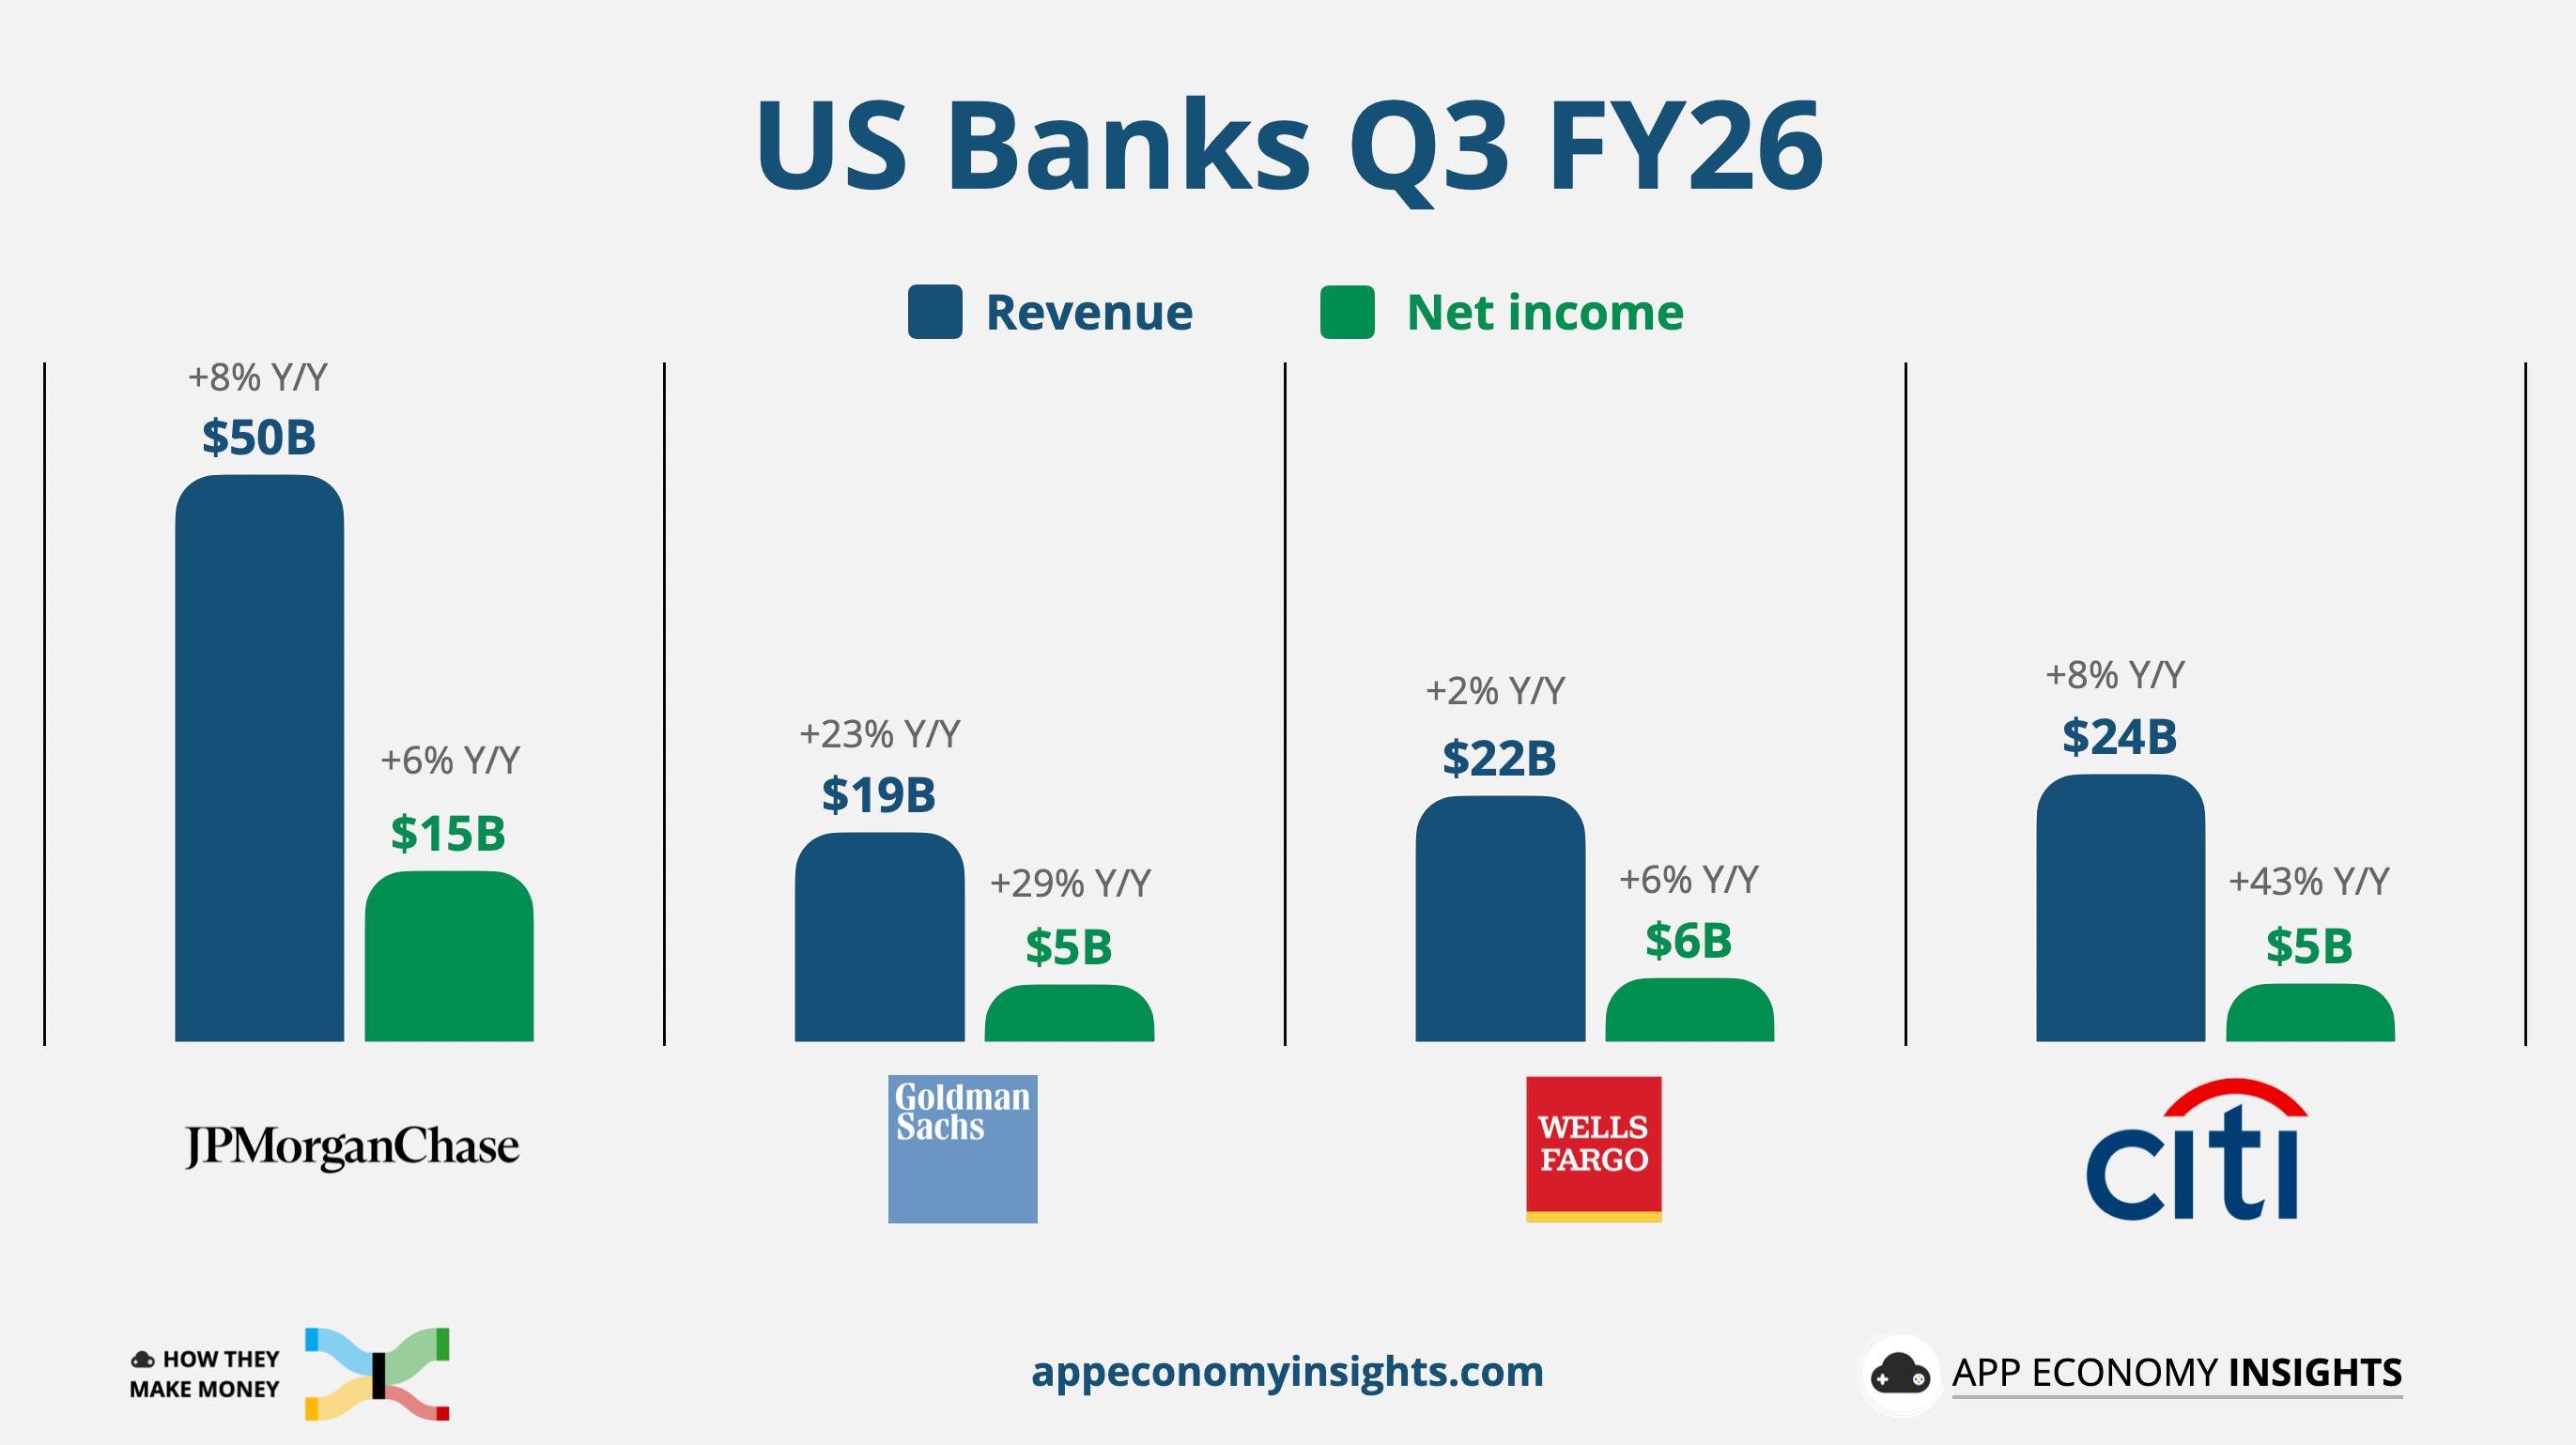
Here are the significant developments shaping Q3 FY26:
📊 The trading boom splits: Equities remain on fire, led by Goldman Sachs (+72% Y/Y) and JPMorgan (+49%). But fixed-income trading declined at both banks as higher bond yields weighed on activity. Citi bucked the trend with 4% growth. Wall Street’s trading windfall is becoming increasingly uneven.
🏦 Higher rates cut both ways: JPMorgan raised its FY26 net interest income outlook to $106.2 billion, while Citi also lifted its guidance. Wells Fargo, however, held its outlook unchanged. Higher rates support lending income but also raise funding costs and create losses on existing bond holdings.
💳 Consumers keep spending: Card spending grew 10% at JPMorgan and 13% at Citi, while credit losses remained manageable across the group. Businesses are also holding up, supported by strong balance sheets and investment in AI infrastructure. Despite sticky inflation and higher borrowing costs, the anticipated credit deterioration has yet to materialize.
🎯 Profitability takes center stage: Citi raised its FY26 return target above 11% as its restructuring delivers results. Wells Fargo continues expanding its balance sheet after the removal of its asset cap, but revenue growth remains modest. The next challenge is converting growth into sustainable profits without letting expenses or funding costs erode the gains.
🔑 Takeaway: The banks are still growing, but the easy gains from the capital-markets boom are fading. Strong lending activity and healthy credit provide a solid foundation, while the divergence in trading and margins highlights how differently each franchise is positioned. Can earnings growth outlast the unusually favorable conditions of the past few quarters?
Let’s visualize them one by one and highlight the key points.
JPMorganChase: Lending Takes the Lead
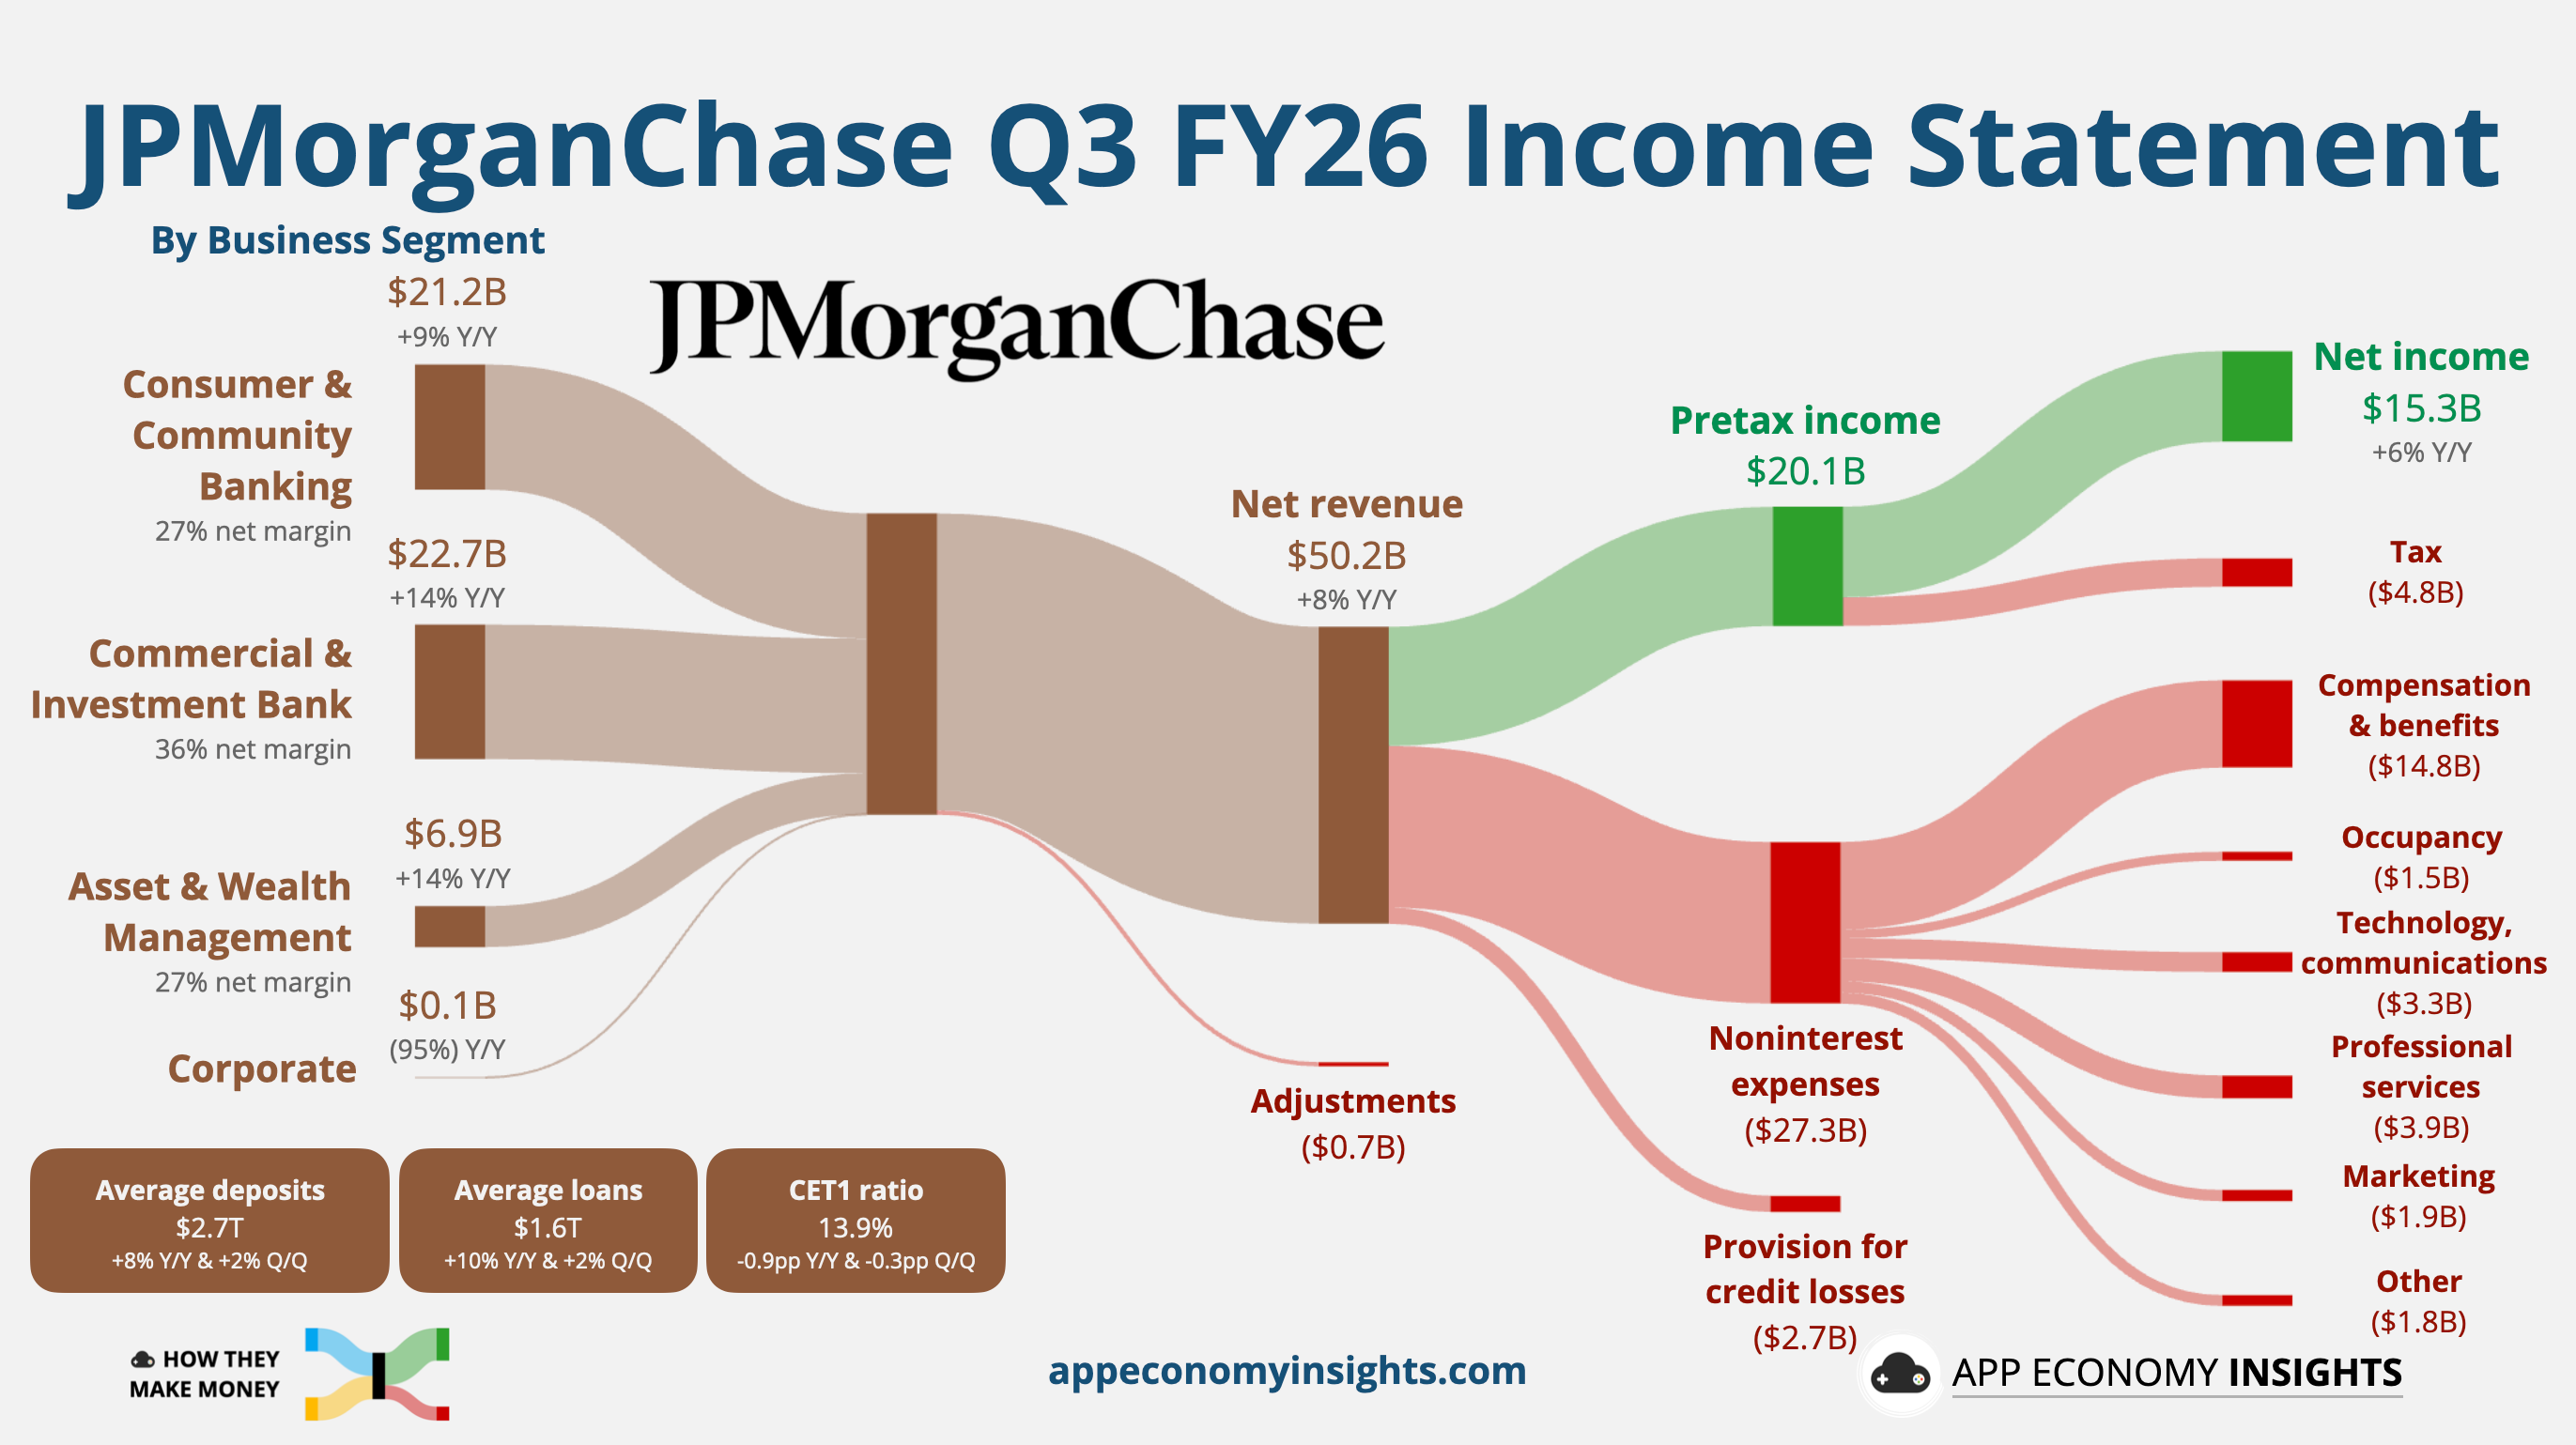
Net revenue grew 8% Y/Y to $50.2 billion ($0.3 billion miss):
Net interest income (NII): $27.0 billion (+13% Y/Y).
Noninterest income: $23.1 billion (+3% Y/Y).
Net income: $15.3 billion (+6% Y/Y).
Adjusted EPS: $5.75 ($0.19 miss), excluding $658 million in investment securities losses. Reported EPS was $5.57.

Key developments:
📉 Trading momentum fades: Trading revenue grew 15% Y/Y to $10.3 billion but missed expectations. Equities surged 49% to $5.0 billion, JPMorgan’s best third quarter ever, while fixed-income trading declined 4% to $5.4 billion. Investment banking fees rose 14% to $3.0 billion but fell sequentially as dealmaking slowed in September. Wall Street activity is cooling after an exceptional Q2.
🏦 Interest income surprises: NII rose 13% to $27.0 billion, prompting JPMorgan to raise its FY26 outlook to ~$106.2 billion (from ~$105.5 billion). Management also introduced a 2027 base case of ~$107 billion in NII excluding Markets, up ~10% from its FY26 estimate of $97.2 billion on the same basis. Loan growth and higher rates are strengthening the bank’s core earnings engine.
💳 Consumers remain resilient: Consumer banking revenue grew 9% to $21.2 billion, helped by 10% growth in card spending. JPMorgan added more than 650,000 net new checking accounts. The card net charge-off rate improved to 2.91% (from 3.34% in Q2), while management maintained its FY26 forecast of ~3.2%.
⚠️ Credit quality holds up: Credit-loss provisions fell 19% Y/Y to $2.7 billion, while net charge-offs declined to $2.2 billion. Consumer loan charge-offs improved to 1.27% (from 1.42% in Q2), while wholesale losses remained low at 0.11% (from 0.10%). However, JPMorgan added $452 million to wholesale reserves, reflecting loan growth and some changes in borrower credit quality.
💰 Buybacks slow sharply: JPMorgan repurchased just $1.1 billion of stock (from $6.7 billion in Q2), despite its new $50 billion authorization. Management favors investing in the franchise and supporting client lending over repurchases. With a 13.9% CET1 ratio, the slowdown appears to be a capital allocation choice rather than a constraint.
📈 Wealth management expands: Revenue rose 14% to $6.9 billion, supported by $263 billion in client asset net inflows. Assets under management reached $5.2 trillion (+13%), while total client assets climbed to $7.9 trillion (+15%). Growing fee-generating assets help diversify earnings beyond lending and trading.
💸 Expenses keep rising: Costs increased 12% to $27.3 billion, prompting JPMorgan to raise FY26 adjusted expense guidance to ~$108.6 billion (from ~$107.5 billion). Higher compensation, technology, and marketing spending drove the increase. Costs are growing faster than revenue, pressuring operating leverage despite healthy business activity.
🔑 Takeaways: JPMorgan’s earnings miss reflects weaker capital markets activity rather than broad deterioration. Rising NII, resilient consumers, and continued loan growth provide an offset. The decision to sharply reduce buybacks suggests management sees more attractive opportunities to deploy capital within the business.
Key quote:
CEO Jamie Dimon:
“Large fiscal deficits, sticky inflation, elevated asset prices, rising interest rates and geopolitical conditions continue to shift under the surface.”