☁️ 7 Traits To Watch in Cloud Stocks
Know these metrics before investing in software businesses
Greetings from San Francisco! 👋🏼
A warm welcome to the recent additions to our community!
Over 55,000 How They Make Money subscribers turn to us weekly for business and investment insights. Glad you're here.
“Software is eating the world.”
Marc Adreessen’s 2011 essay still resonates today. His prediction has become our reality. Today, tech giants compose roughly a quarter of the S&P 500 and have significantly influenced market returns over the last decade.
Gartner projects cloud services to grow by 22% this year and reach nearly $600 billion. The SaaS category is the largest, making up a third of the spending.
Cloud software stocks are currently out of favor. To illustrate, the Wisdom Tree Cloud Computing ETF (WCLD) is 55% off its 2021 peak.
Most of these businesses are still growing (albeit at a smaller pace in a challenging macro environment). We are far from the inflated 2021 valuations following the rapid rise of interest rates.
While the valuation reset offers better entry points, the challenge is to identify defensible moats in a category known for its low barrier to entry.
What makes a software business good or bad?
What indicators should be on your checklist before investing?
Let’s explore seven crucial traits that can guide your decisions.
Today at a glance:
Revenue growth.
Operating leverage.
Retention & expansion.
Sales efficiency.
Capital efficiency.
Category leaders.
Skin in the game.
1. Revenue growth
Stock performance is fundamentally tied to earnings growth. While valuation multiples can be volatile, the actual engine driving long-term investment performance is the underlying business.
Earnings growth comes from two main avenues:
Revenue growth.
Margin expansion.
But here's the catch: profitability has its limits. The genuine game-changers are companies that consistently grow their revenues over extended periods. If you're a long-term investor, the duration of growth often trumps mere speed.
As companies expand, their revenue growth inevitably moderates due to the sheer magnitude of the revenue base. This deceleration is a given. The key is understanding its context:
Is the revenue recurring?
Has growth been consistent?
Can it be extrapolated over time?
Did growth reaccelerate in the past?
Does the current trend appear sustainable?
Is growth coming from price, product, or customer increase?
Consider Paycom Software, a SaaS entity specializing in human capital management for SMBs. An impressive 99% of its revenue is recurrent, bringing high predictability.
The global pandemic impacted SMBs disproportionately, resulting in significant customer attrition through downsizing or closures. Consequently, Paycom faced a revenue growth dip in early 2020.
Yet, their consistent 30% growth rate in the three years preceding the pandemic hinted at a possible bounce back to pre-COVID levels, which indeed materialized.
However, a word of caution: even companies with stellar track records can fail and see their business falter. Overall, gaining context on the nature of the revenue, alongside current influencing factors, remains paramount.
2. Operating leverage
Remember when we discussed recognizing a business's stage in its life cycle?
Many software companies strategically re-invest in the business by design, playing the long game and spending aggressively on customer acquisition because they know the return on investment will pay off over several years, thanks to reliable subscription revenue.
Operating leverage is a measure of how much a company can increase sales without a corresponding increase in costs. When a business demonstrates operating leverage, its revenues grow faster than operating expenses, leading to expanding profits. Conversely, if sales decline, profits can decrease sharply, making it a double-edged sword.
The 'rule of 40' is a favorite among investors screening software companies. This rule means that a software company's growth rate and profit margin—when added together—should be more than 40%. As explained by Thierry Depeyrot and Simon Heap, partners at Bain & Company:
"Software industry executives are embracing the Rule of 40 as an important metric to help measure the trade-offs of balancing growth and profitability."
When we mention the 'rule of 40' and the profit margin component, it's worth noting that investors have different preferences for which margin they consider. Some lean on the Free Cash Flow (FCF) margin or the adjusted (non-GAAP) margin. However, I lean towards using the GAAP operating margin. Why? It’s because it factors in Stock-Based Compensation (SBC), which can be a significant cost for many tech companies. Considering it gives us a more realistic view of the company's margin profile.
Fast growers tend to re-invest in themselves aggressively, expanding R&D teams or doubling down on sales & marketing for customer acquisition.
When high revenue growth is involved, you are likely staring at a company in its hyper-growth phase. It may be loss-making, but the real question is: what could the margins look like when it matures?
Take cybersecurity giant CrowdStrike and its nearly $3 billion Annual Recurring Revenue (ARR). Even with that size, it's growing 37% year-over-year.
Even though CrowdStrike lost money in its latest quarter (ending July 2023), the trend of its operating margin since its IPO shows a different story.
CrowsdStrike has steadily improved its GAAP operating margin and is on the cusp of turning profitable. It’s crucial to focus on where a business will be tomorrow, not where it is today.
3. Retention and expansion
Over time, some customers pay for more services, some scale back their usage, and some leave altogether. As a result, analyzing past cohorts of customers is critical. It shows in two specific metrics: retention and expansion.
Dollar-based Net Retention (DBNR): Measures the revenue retained from existing customers over time, accounting for upsells, downgrades, and churn. For SaaS businesses, it's a testament to customer loyalty and product value. Over 100%? That company grows its revenue even without new customers.
DBNR often goes by Net Revenue Retention Rate (NRR). Some definitions might vary slightly.
Dollar-based Net Expansion (DBNE): Focuses specifically on the growth in revenue from existing customers, primarily through upsells or cross-sells. A value over 100% indicates that current customers are purchasing more services or products, highlighting product stickiness and increasing value to the user base. This metrics ignore the customers who have churned, removing a critical aspect.
An expansion metric is helpful to evaluate the success of a multi-product strategy and see if customers spend more over time. However, when available, the retention metric is a far superior performance indicator for the long term because it includes the impact of churn.
Churn: It's the rate of customer departure. Essential for subscription-based industries. Always prioritize metrics that include churn when evaluating SaaS businesses.
Jamin Ball offers excellent SaaS company KPI comparisons. I recommend checking his blog.
A top-tier DBNR should be a prime consideration for SaaS investments. It's a tangible way to assess the sustainability and relevance of a product for its customers.
Take Snowflake, boasting a market-leading 142% retention. Keep in mind it will normalize over time (like revenue growth) as the business scales.
Few exceed a 120% net retention rate. Due to its significance, there's a tight link between DBNR and company valuation multiples. Beware of "cheaper" SaaS stocks. Like most things in life, you often get what you pay for.
4. Sales efficiency
Software companies often face criticism for directing the lion's share of their revenue towards sales & marketing. Selling a dollar for 90 cents might pump up revenue growth, but it isn't a sustainable business. Hence, understanding the underlying economics becomes essential.
A company excelling in revenue growth, margin expansion, and customer retention is on the right track. But what about its sales efficiency?
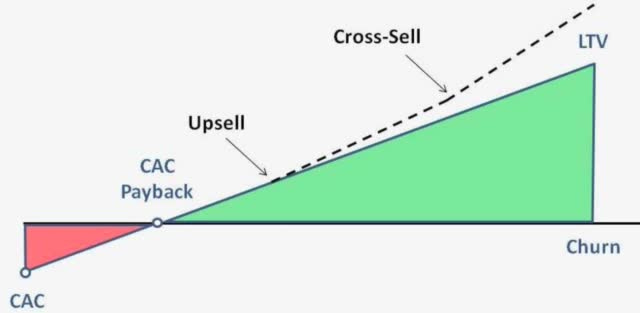
Enter the CAC Payback Period.
I came across this concept as an executive in the gaming industry, working on free-to-play games. Video game publishers spend money on ads to generate downloads. As long as the LTV (Customer Lifetime Value) is over the CAC (customer acquisition costs), this is money well spent. The CAC Payback Period (expressed in months) illustrates how many months it would take to recoup your investment in sales & marketing based on your current revenue run rate. A quick recoupment often points to a solid product-market fit.
To determine the CAC Payback Period for public software companies, you primarily need:
Sales & marketing costs from the previous quarter (the CAC).
Net new ARR (Annual Recurring Revenue) in the most recent quarter.
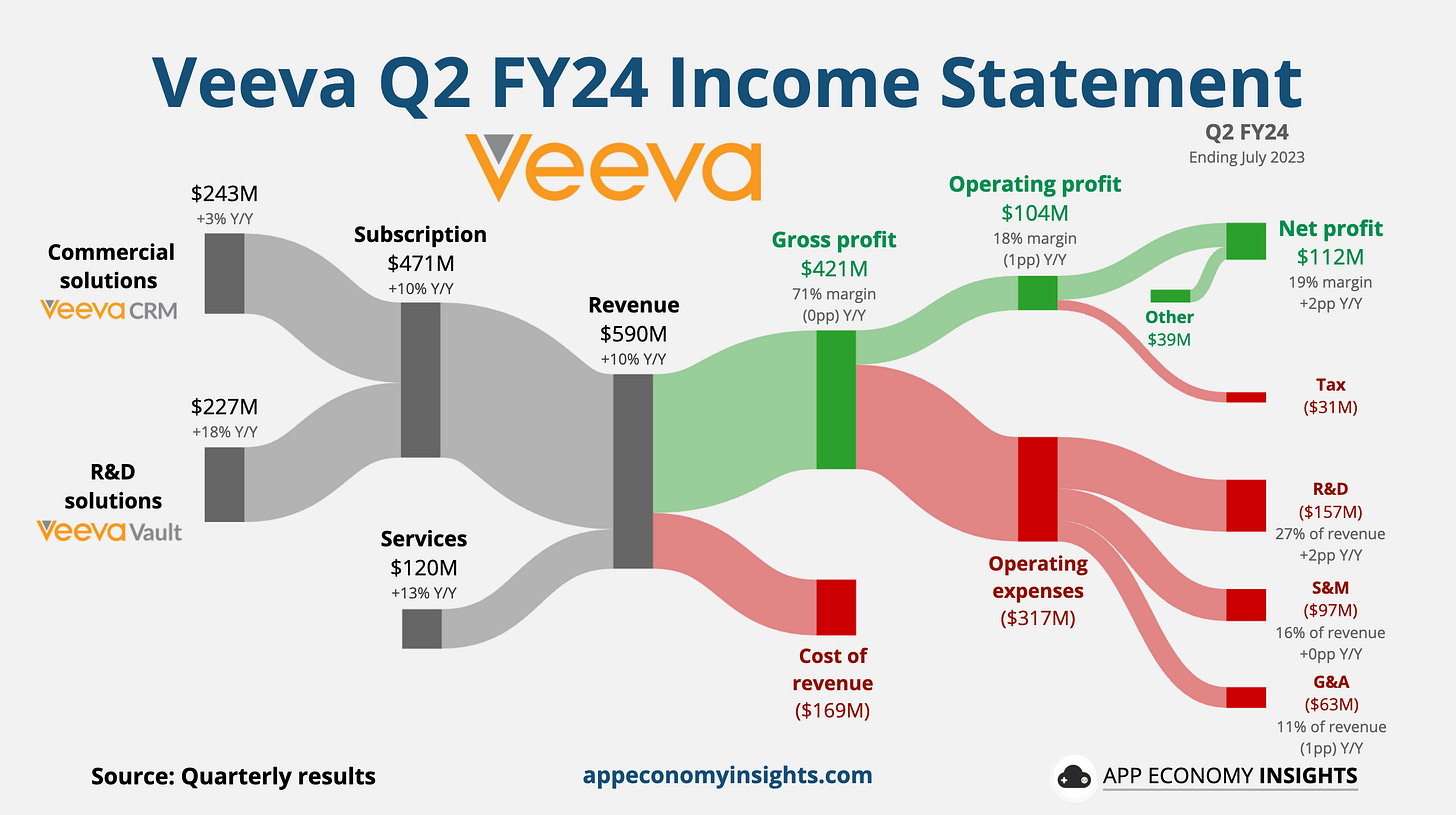
While the first is easily gleaned from the income statement, the latter can be slightly tricky to estimate. Suppose the company doesn't directly report ARR. In that case, we have to calculate it by using the subscription revenue added sequentially in the most recent quarter and multiplying it by four to get an annual number.
To factor the cost to deliver the service into the equation, we then apply the gross margin to the Net New ARR to obtain the new incremental recurring gross profit expected in the next 12 months:
(Sales & Marketing expenses from the previous quarter) /
(Net new ARR x Gross Margin)
The outcome indicates the years required for the previous quarter's sales & marketing expenses to be offset by anticipated new gross profit. Multiplying this by twelve offers the CAC Payback Period in months.
Veeva is particularly efficient at acquiring new customers, recouping its CAC in under seven months. It’s a favorable trait from its focus on the life science industry.
Before dismissing a company for excessive sales & marketing spending, evaluate its payback period. If payback is below 24 months and management has good visibility on future revenue, it’s probably money well spent.
5. Capital efficiency
Now that the interest-free era is behind us, cash flow has become even more critical.
There are two main aspects to consider:
Balance sheet: Does the company have a net cash position? If not, how many years would it take to clear its debt? It might be wise to consider other options if it's beyond three or four years. This method, inspired by the book "Warren Buffett and the Interpretation of Financial Statements," offers a straightforward litmus test.
Cash flow margins: Is the business generating cash from operations? If so, it provides a margin of safety, enabling the company to finance its growth organically.
Many software businesses lean heavily on Stock-Based Compensation (SBC) as a reward mechanism. While this means no cash is exiting the company, shareholders face dilution.
Considering the free cash flow after deducting SBC becomes essential. A perfect example is Atlassian. Renowned for its impressive free cash flow margins, the business remains unprofitable.
However, Atlassian has a robust balance sheet with a significant net cash position and generates a ton of cash every quarter. While existing shareholders get diluted, the company's enterprise value improves as the business builds up its cash reserve.
Positive cash flow is more critical than profitability to give a company optionality, be it through opportunistic M&A or weathering a downturn. But watch out for SBC.
6. Category leaders
Wondering how to pinpoint premier B2B software, particularly when it’s outside of your circle of competence?
Several invaluable market intelligence tools help determine top B2B software:
To name a few:
Gartner: Offers research and analysis on IT businesses. Their Magic Quadrant and Hype Cycle highlight a B2B software business's competitive position.
Forrester: Provides sector-specific reports, with Wave reports giving insights into B2B software markets.
IDC: Focuses on market research for IT, telecommunications, and consumer tech.
DB-Engines: Ranks database management systems. It helps understand the popularity and trends of databases in the software sector.
G2: A peer-to-peer review platform that gives firsthand software and service experiences. It offers a perspective on user satisfaction and software effectiveness.
These platforms serve as an excellent starting point for deeper dives.
Let’s take the example of the CRM category (Customer Relationship Management).
We recently analyzed Salesforce, a stalwart focused on Enterprise customers. There is another crucial player in this category focused on SMBs called HubSpot. Like Salesforce, its revenue stream is predominantly subscription-based. However, the company is at a much earlier stage in its lifecycle, growing north of 20% while not yet turning a profit.
If we look at the G2 Grid for CRM, Salesforce and HubSpot stand out, outpacing competitors in market presence and customer satisfaction. Monday Sales CRM trails as a distant third.
The core takeaway? If a firm languishes as the fifth or sixth best in its niche, why bother? Recognizing developers' preferences is pivotal since they evangelize these tools within their organizations.
7. Skin in the game
Beyond quantitative KPIs, it’s critical to assess the people in charge. To evaluate the management team, consider these pivotal questions:
Is the founding team still involved?
Are they still invested in the company?
Are there signs of a strong leadership culture?
In an ideal world, you should be able to answer "yes" to these three questions.
The Influence of Founding Teams
Research by Bain & Company reveals that companies with active founding members outperformed others by 3.1 times over 25 years (from 1990 to 2014). Chris Zook, Advisory Partner, observes that such companies excel at maintaining sustained, profitable growth.
The rationale? Founders possess a profound commitment. The business is a manifestation of their vision and tenacity. They exhibit dedication, practicality, and are poised to embrace risks for the company's ascent.
The Importance of Insider Ownership
As emphasized by Charlie Munger, an ownership perspective demands proper motivation, often manifested as high insider ownership.
The Significance of Company Culture
Platforms like Glassdoor or Comparably, where employees review their organizations, offer insights into a company's culture. Stellar reviews aid in attracting and retaining talent, especially in competitive markets like the San Francisco Bay Area.
History shows that how employees praise their company might be a more compelling investment factor than P/E ratios, free cash flow margins, or other financial metrics. This is a conclusion reached by Fortune after reviewing the performance of companies considered top employers. After reviewing years of performance from Glassdoor’s Best Places To Work, I've reached the same conclusion.
Bottom Line
Evaluating software companies requires a multifaceted approach.
There’s only so much you can learn in a spreadsheet. A glance at the financials is not going to cut it. Using a blend of quantitative KPIs and qualitative insights, investors can make informed decisions, ensuring they back not just a business with strong numbers but one with superior products, a sustainable vision, and a motivated team at its helm.
That’s it for today!
Stay healthy and invest on!
Apply to Sponsor Us
We're offering new sponsorship opportunities for B2B and B2C brands to get in front of our audience of investors and business leaders. Click here to learn more.
Get Your Business a Custom Chart
Interested in custom charts for your organization or brand? Complete the form here, and we'll get in touch.
Disclosure: I am long CRM, CRWD, HUBS, PAYC, SNOW, TEAM, and VEEV in the App Economy Portfolio. I share my ratings (BUY, SELL, or HOLD) with App Economy Portfolio members here.
Author's Note (Bertrand here 👋🏼): The views and opinions expressed in this newsletter are solely my own and should not be considered financial advice or any other organization's views.


