⏯️ Meta: Reels Gets it Done
And Meta AI unveils Llama 2's capabilities
Greetings from San Francisco! 👋
A warm welcome to the recent additions to our community!
Over 60,000 How They Make Money subscribers turn to us weekly for business and investment insights. Glad you're here.
Meta has delivered an impressive revenue growth acceleration in Q3 FY23.
During the earnings call, CEO Mark Zuckerberg shared a pivotal update on Reels—Meta’s answer to the short-form video craze initiated by TikTok:
“Reels has now driven more than 40% increase in time spent on Instagram since launch. We also reached a monetization milestone earlier than expected. And we estimate that Reels is now net neutral to overall company ad revenue.”
Historically, Reels lagged in revenue growth despite higher engagement—a common trend for new features. This trend has now been bucked.
🎥 Zuck also mentioned that half of the time users spend on Facebook and Instagram is now devoted to video content—a concept that would have seemed outlandish just a few years back. Remember, Instagram only introduced Reels in August 2020, with Facebook following suit in March 2021.
A crucial factor in the resilience of Meta's apps, even with TikTok's meteoric rise, is their transformation into fundamentally different platforms.
In addition to a full review of Meta’s quarter visualized and recent business developments, we’ll put the company’s performance in context with a look at Snap and Pinterest.
Today at a glance:
Meta Q3 FY23.
AI agents and mixed reality.
Key quotes from the earnings call.
What to watch looking forward.
Before we dive in, a quick reminder: Meta's financials are an alphabet soup of metrics and acronyms. If you're ever in doubt, take a peek at our short guide to these terms from our prior article linked below for a refresher.
And if you don’t click through, these are the essentials:
Meta has two business segments:
FoA: Family of Apps (Facebook, Instagram, Messenger, and WhatsApp).
RL: Reality Labs (virtual reality hardware and supporting software).
Key metrics:
DAU & DAP: Daily Active Users (Facebook) or People (FoA).
MAU & DAP: Monthly Active Users (Facebook) or People (FoA).
ARPU & ARPP: Average Revenue Per User (Facebook) or People (FoA).
1. Meta Q3 FY23
Key metrics:
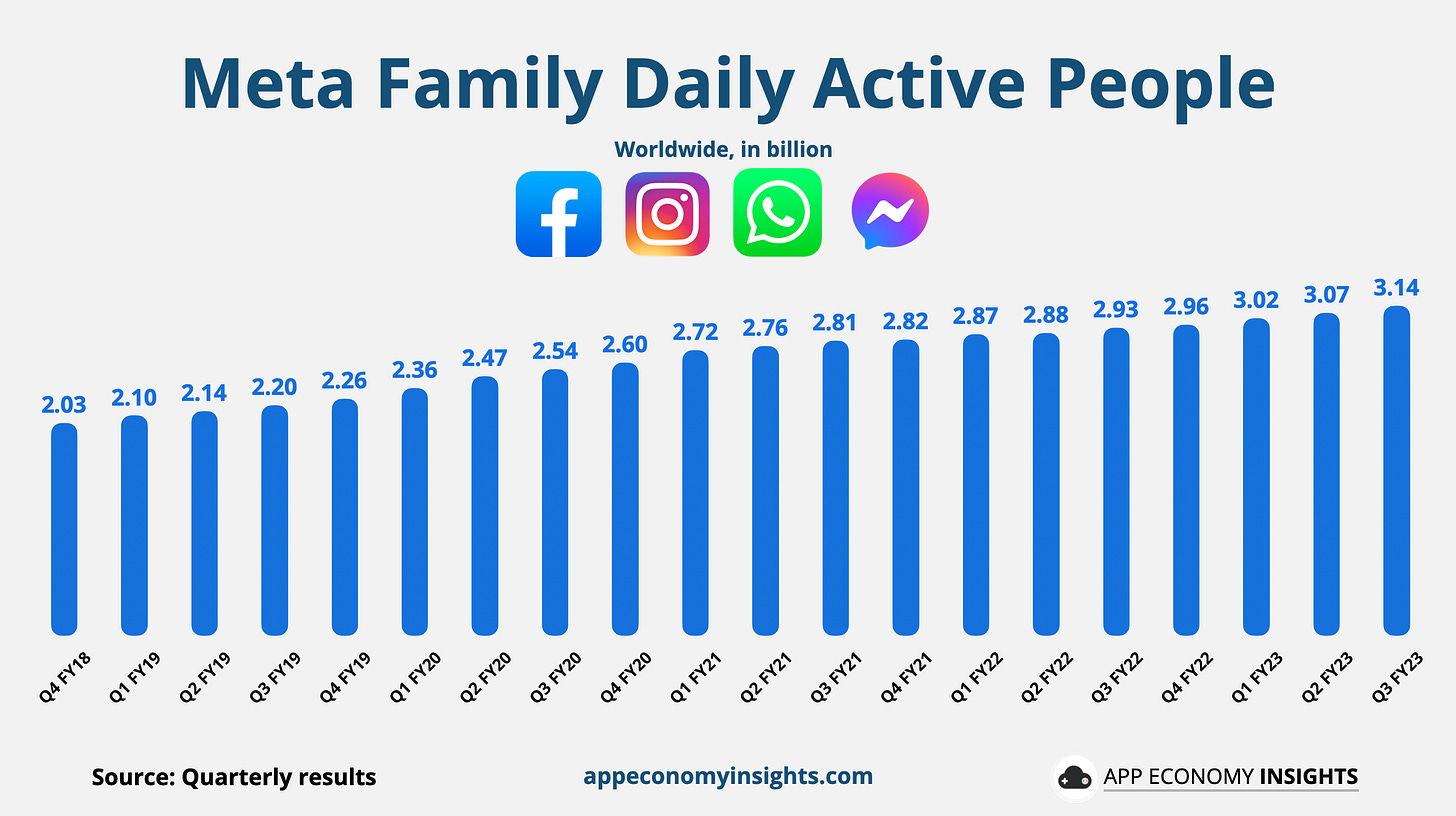
Family DAP grew +7% Y/Y to 3.14 billion (+70 million Q/Q).
Family MAP grew +7% Y/Y to 3.96 billion (+80 million Q/Q).
This chart usually prompts two initial reactions:
Facebook is probably not contributing to the user growth anymore.
The numbers are likely inflated due to bots.
However, the data challenges these beliefs—half of the 1.1 billion Daily Active People added in the past five years came from Facebook, which continues to experience growth not just in users but also in revenue per user, contrary to the narrative of its decline. In addition, the rise in revenue per user indicates that the return on ad spend remains highly competitive.
Let’s look closer at the numbers.


