🔥 Match Group: Dating as a service
The online dating leader is shifting its organization to stay on top
Hello there! 👋
Greetings from San Francisco!
Welcome to the new members who have joined us this week!
Join the tens of thousands of How They Make Money subscribers receiving insights on business and investing every week.
Happy Valentine’s Day!
Match Group (MTCH) recently reported its earnings, so I couldn’t resist the opportunity to review the business of the online dating giant on the 14th of February.
Today, we’ll cover the following:
Match Group FY22.
Recent business highlights.
Key quotes from the earnings call.
What to watch looking forward.
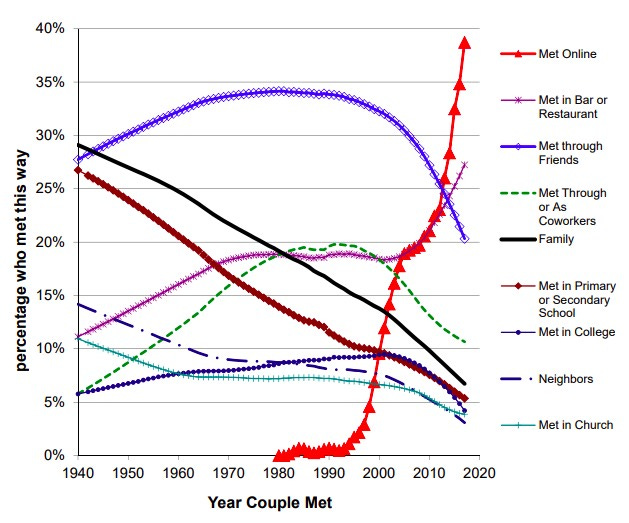
A Standford University study (How Couples Meet and Stay Together) surveyed how Americans meet their spouses and romantic partners over time.
In 2017, around 40% of couples met online. That makes online dating by far the most common way American couples meet. The chart below shows you everything you need to know about the trend.
Dating apps emerged in the transition of the matchmaking industry from analog to digital. But online dating is still stigmatized, particularly in specific age groups and geographies.
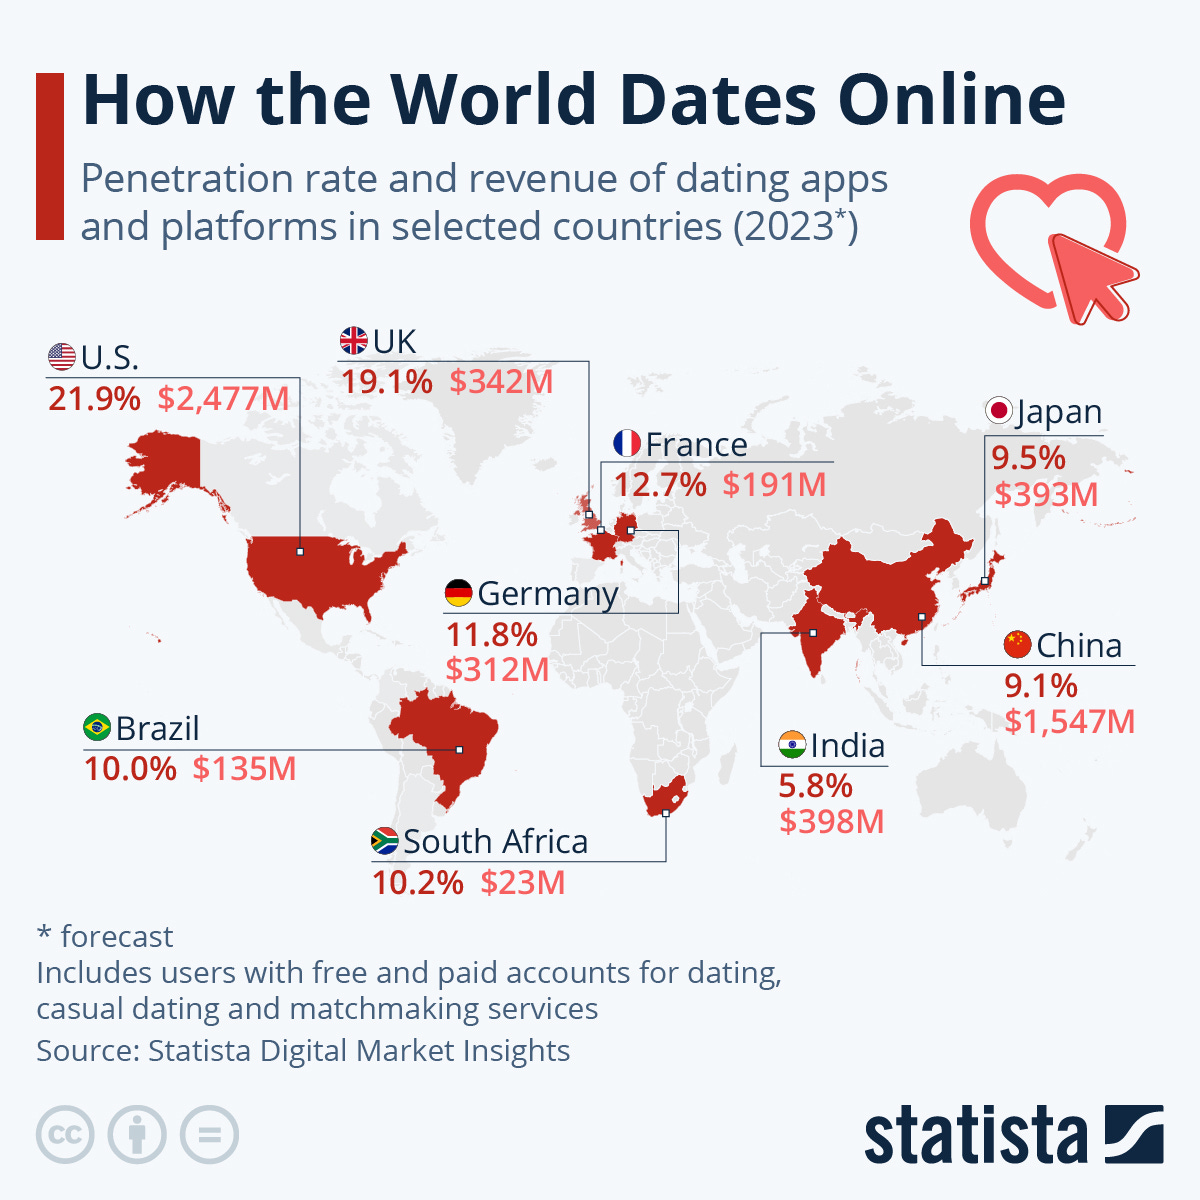
According to Statista Digital Market Insights, the United States has the highest percentage of its population using online dating services in 2023, at 22%. That number is below 10% in Japan, China, and India.
As a gaming industry veteran, I’ve always been fascinated by Match Group and its business model. It’s a highly profitable business, but not without its fair share of challenges.
Dating apps have a lot in common with free-to-play mobile games. So it should be no surprise that Bernard Kim, previously President of Zynga, was hired as the new CEO of Match Group last year.
You can download them and “play” for free, forever.
The vast majority of users won’t spend a dime on the apps. Instead, the revenue for the company comes from the few spenders who decide to pay for a monthly subscription or buy a la carte items for enhanced features.
The free-to-play business model is governed by the power law (you might know it as Pareto or the 80/20 rule), where 20% of users drive 80% of revenue. In short, not all users are equal.
From gaming to gambling, spenders are often associated with sea creatures:
Minnows spend the smallest amount possible.
Dolphins spend a modest amount. Typically a few dollars per month.
Whales spend a lot. $20 per month or a lot more.
Whales make up most of the revenue, even though they make up a small portion of the user base.
It’s unclear how many people regularly use one of Match Group’s dating apps. While companies making revenue through advertising (like Meta, Snap, or Pinterest) share their daily or monthly active users, Match Group only shares its number of payers (those who have spent money during the period).
Two key metrics impact the revenue:
🧑🏼❤️🧑🏽 Payers: Users who spend money in a given month.
💵 Revenue per Payers (RPP): Monthly amount spent by Payers.
Match Group had 16 million payers across its apps at the end of 2022.
The company just updated its revenue segmentation to help us digest its performance. However, it only provided the new segmentation for the full year FY22, with some partial data on growth Y/Y.
So let’s comb through what we know.
Revenue breakdown:
Tinder (~56% of overall revenue): The most popular dating app worldwide.
Hinge (~9%): The portfolio's fastest-growing dating app.
Asia (~10%): The largest opportunity and untapped market. It includes:
Pairs, a leading app in Japan.
Hyperconnect, a Seoul-based company acquired in 2021 for $1.7 billion.
Evergreen and Emerging (~10%). They include legacy (Match, OKCupid, Plenty of Fish) and new apps (BLK, Chispa, The League).
Indirect (2%) : Advertising, partnerships.
Costs and expenses include:
Cost of revenue: Match Group relies on the Apple App Store and the Google Play Store to distribute its apps. They generally pay a 30% commission (or 15% on subscription revenue on Google Play). Infrastructure costs (cloud services) are also included here.
Sales & marketing: Social media advertising, search engine marketing, email campaigns, partnerships, and content creation.
General & administrative: Executive management, finance, legal, tax, human resources, and acquisition-related costs.
Product development: Employee-related costs for the design, development, testing, and enhancement of the apps.
Amortization: Match Group has been acquisitive over the years. So intangible assets on the balance sheet are regularly re-evaluated, which can lead to write-offs, creating temporary increases in GAAP expenses.
Margins:
The gross margin is very high, around 70%. Most of the cost incurred by Match Group is the app store transaction fee paid to Apple or Google. Not all transactions are subject to the same fee based on their nature (subscription or in-app purchase). The gross margin has trended down in recent years, with mobile becoming an increasing share of the revenue mix.
The operating margin has been close to 30% over the years. However, it fell to 16% in FY22 due to the amortization of some of its intangible assets (more on that in a second).
Let’s look at the most recent quarter.
1. Match Group FY22
Memberships key metrics:
Payers declined -1% Y/Y to 16.1 million.
Revenue per payer (RPP) fell 1% Y/Y to $16. But it was up +7% Y/Y fx neutral.
While payers continue to spend more, the conversion from free to paid was slightly worse in a more challenging environment.
Income statement:
Here is the bird’s-eye view of the income statement.
Some notes on the new segmentation:


