

📊 Make Your Own Charts
Our data partners have you covered

Welcome to the Free edition of How They Make Money.
Over 200,000 subscribers turn to us for business and investment insights.
As the saying goes:
"Give a man a fish and you feed him for a day. Teach him how to fish and you feed him for a lifetime"
Over the years, I've been asked many times what useful investing tools I would recommend as part of the perfect research flow.
I want to share a tool with you that has dramatically improved my daily research process this year, and I can't wait for you to try it for yourself.
It's called Fiscal.ai, and you can start using it for free today.

Fiscal.ai now powers my charts and financial data and gives you a fast, affordable way to research stocks and build some of the visuals I use.
I’ve spent the past few months researching new stock ideas inside Fiscal.ai:
Screeners.
Chart builder.
Portfolio tracker.
Earnings materials.
Side-by-side comparisons.
Quick fundamentals overlays.
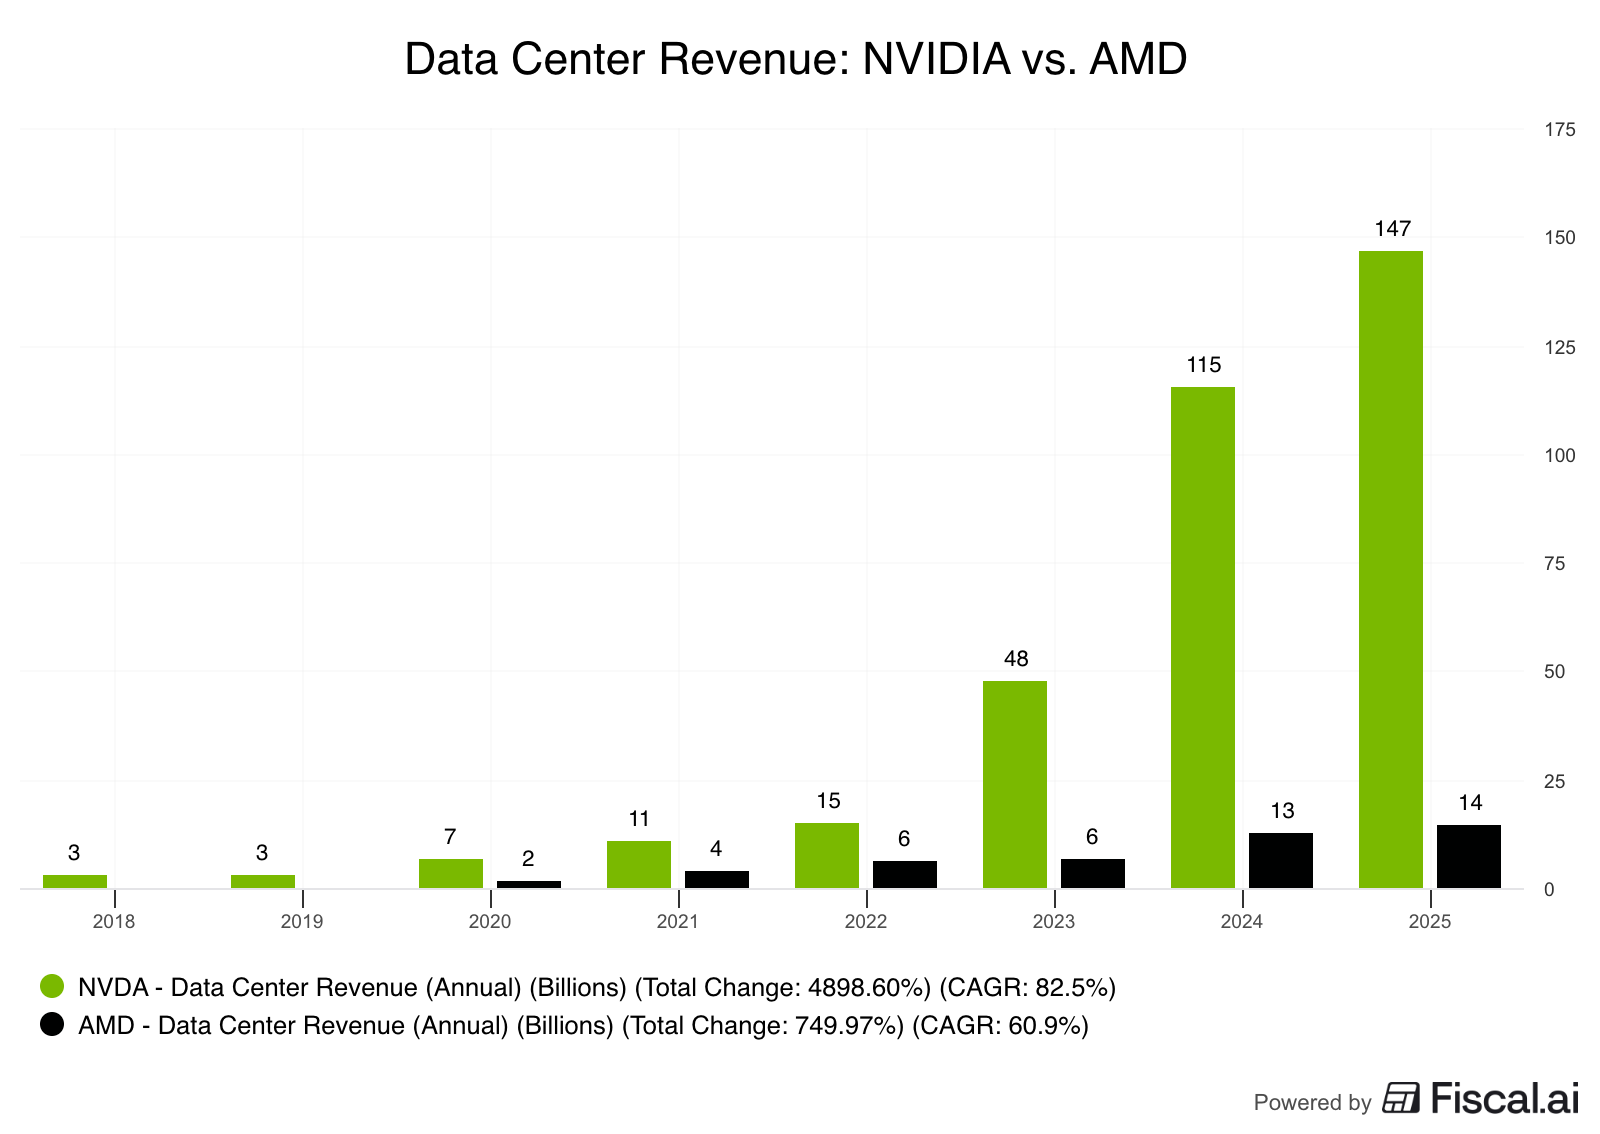
In particular, Fiscal.ai allows for the selection of specific company segments. Think Amazon's AWS or NVIDIA's Data Center revenue.

It’s become my go-to tool. I liked it so much that I reached out to them to propose a partnership and make them my official data platform.
What you can do with it
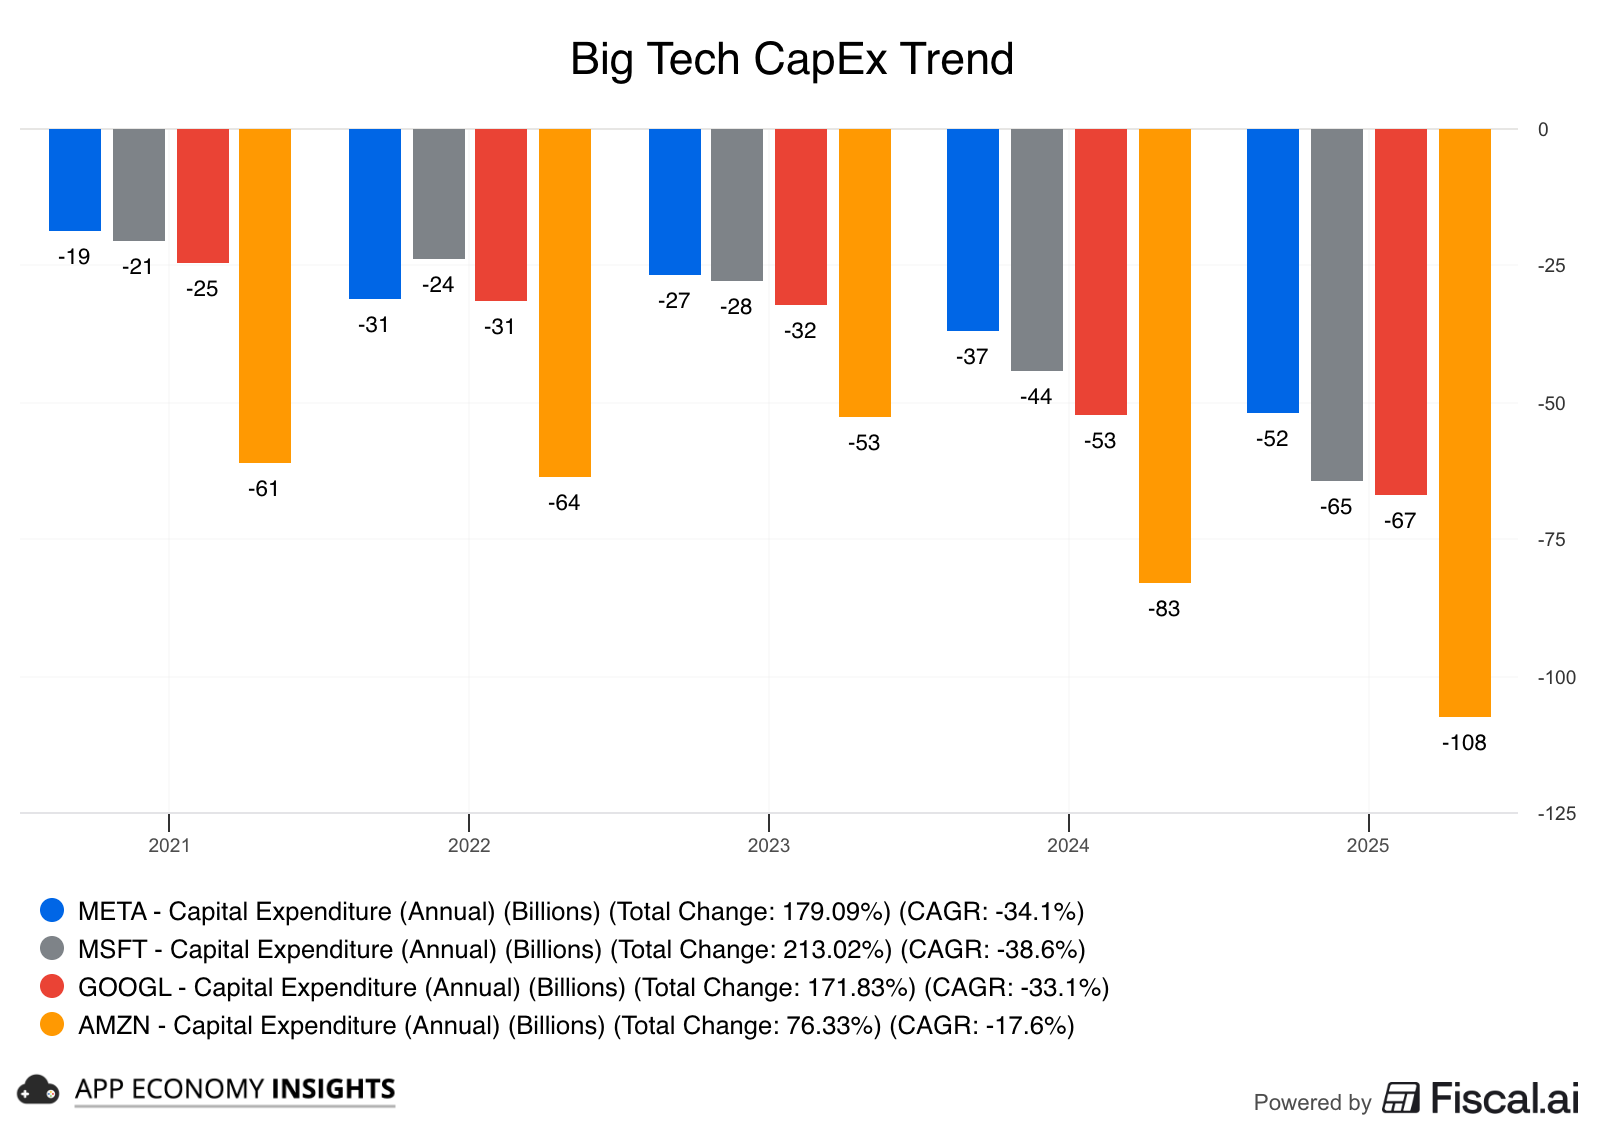
1) Segment analysis across companies
Below are three simple, high-impact chart setups I’ll use often, and that you can recreate in minutes.
Data Center Revenue: NVIDIA vs. AMD
Capital expenditure comparison across Big Tech.
Forward EV/Sales multiple: CRWD vs. ZS vs. FTNT vs. PANW vs. OKTA.

2) Price vs. Fundamentals
Use case: Is the stock tracking the business or just sentiment?
How to build it
It's as easy as selecting the companies you want to analyze and picking the metrics you want to see over time.
Below is a great example, with the wild fluctuation of Shopify's stock price while business metrics have steadily improved. It clearly shows the stock was overbought in 2021 and oversold in 2022.
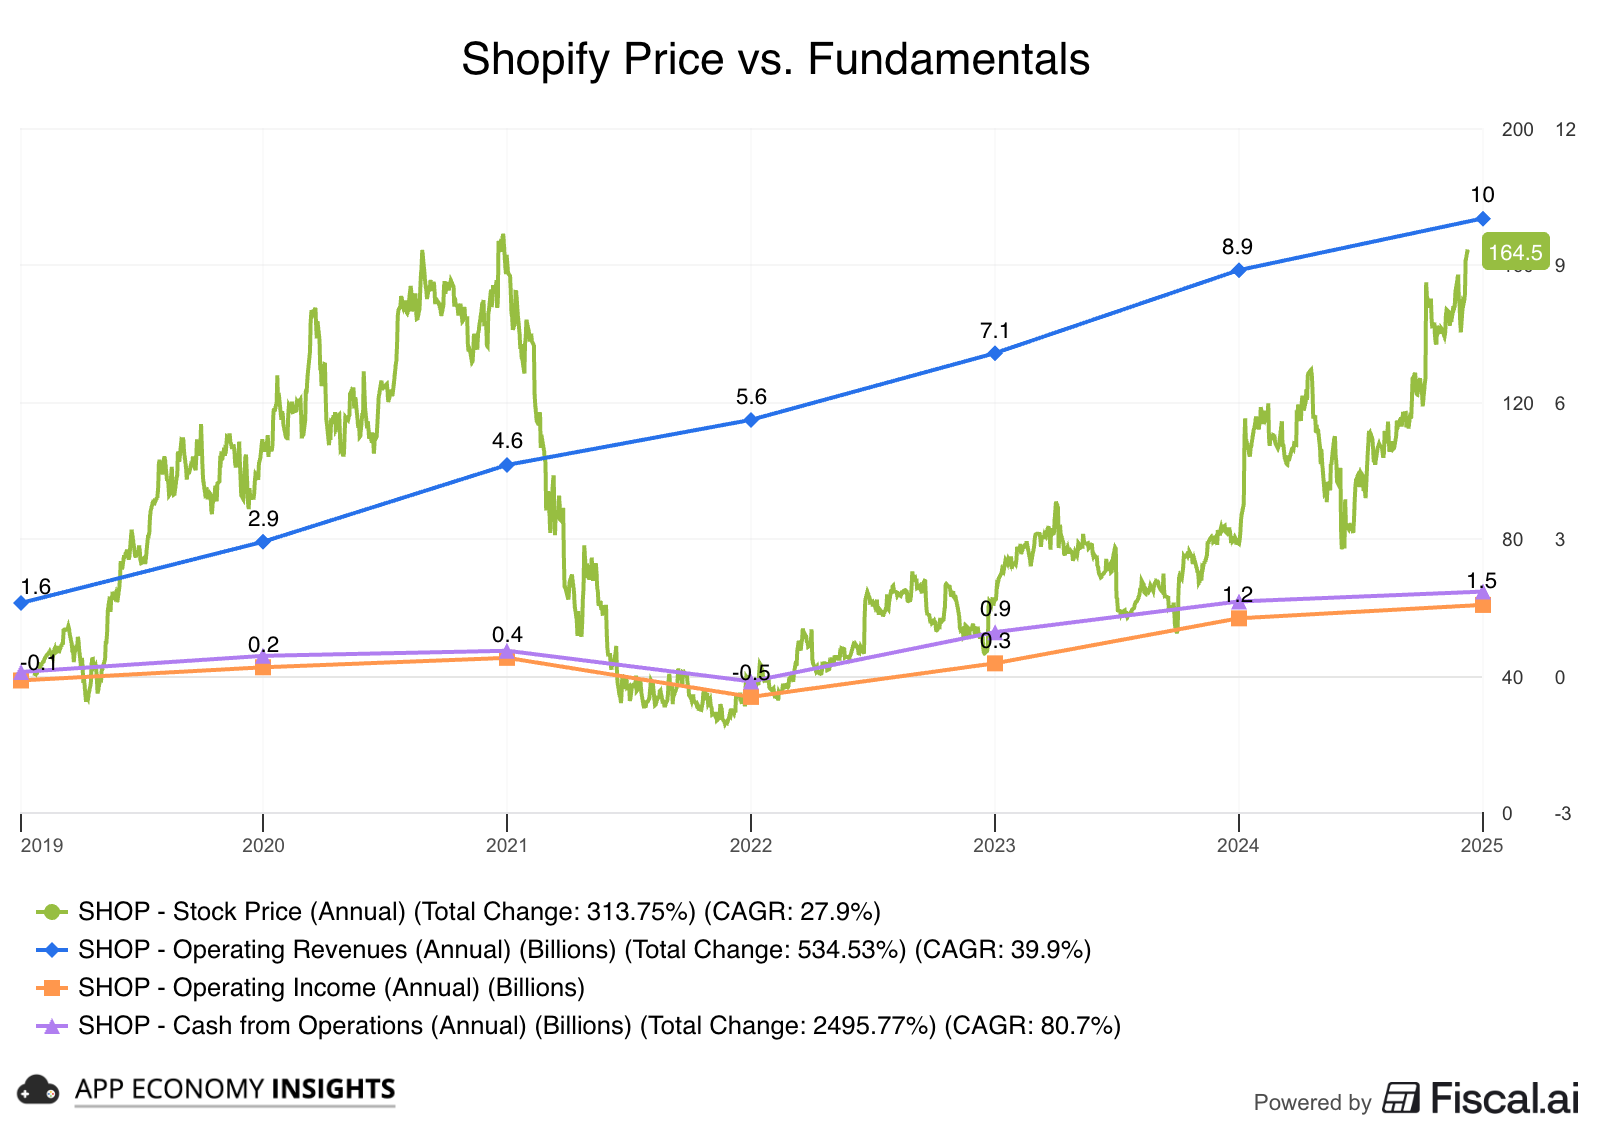
You can swap in other metrics like gross profit or free cash flow if you are looking for specific trends.
3) Clean comparisons in seconds
Use case: Compare two or more series fairly, regardless of starting levels.
How to build it
Add multiple metrics or companies.
Select Price % Change to see how a given metric has grown over time.
Choose “Index to 0” to see the % change with the same starting point.
Below is an example that shows NVIDIA's stock price and operating cash flow in the past 5 years. They are both up 13x, illustrating a perfect correlation.
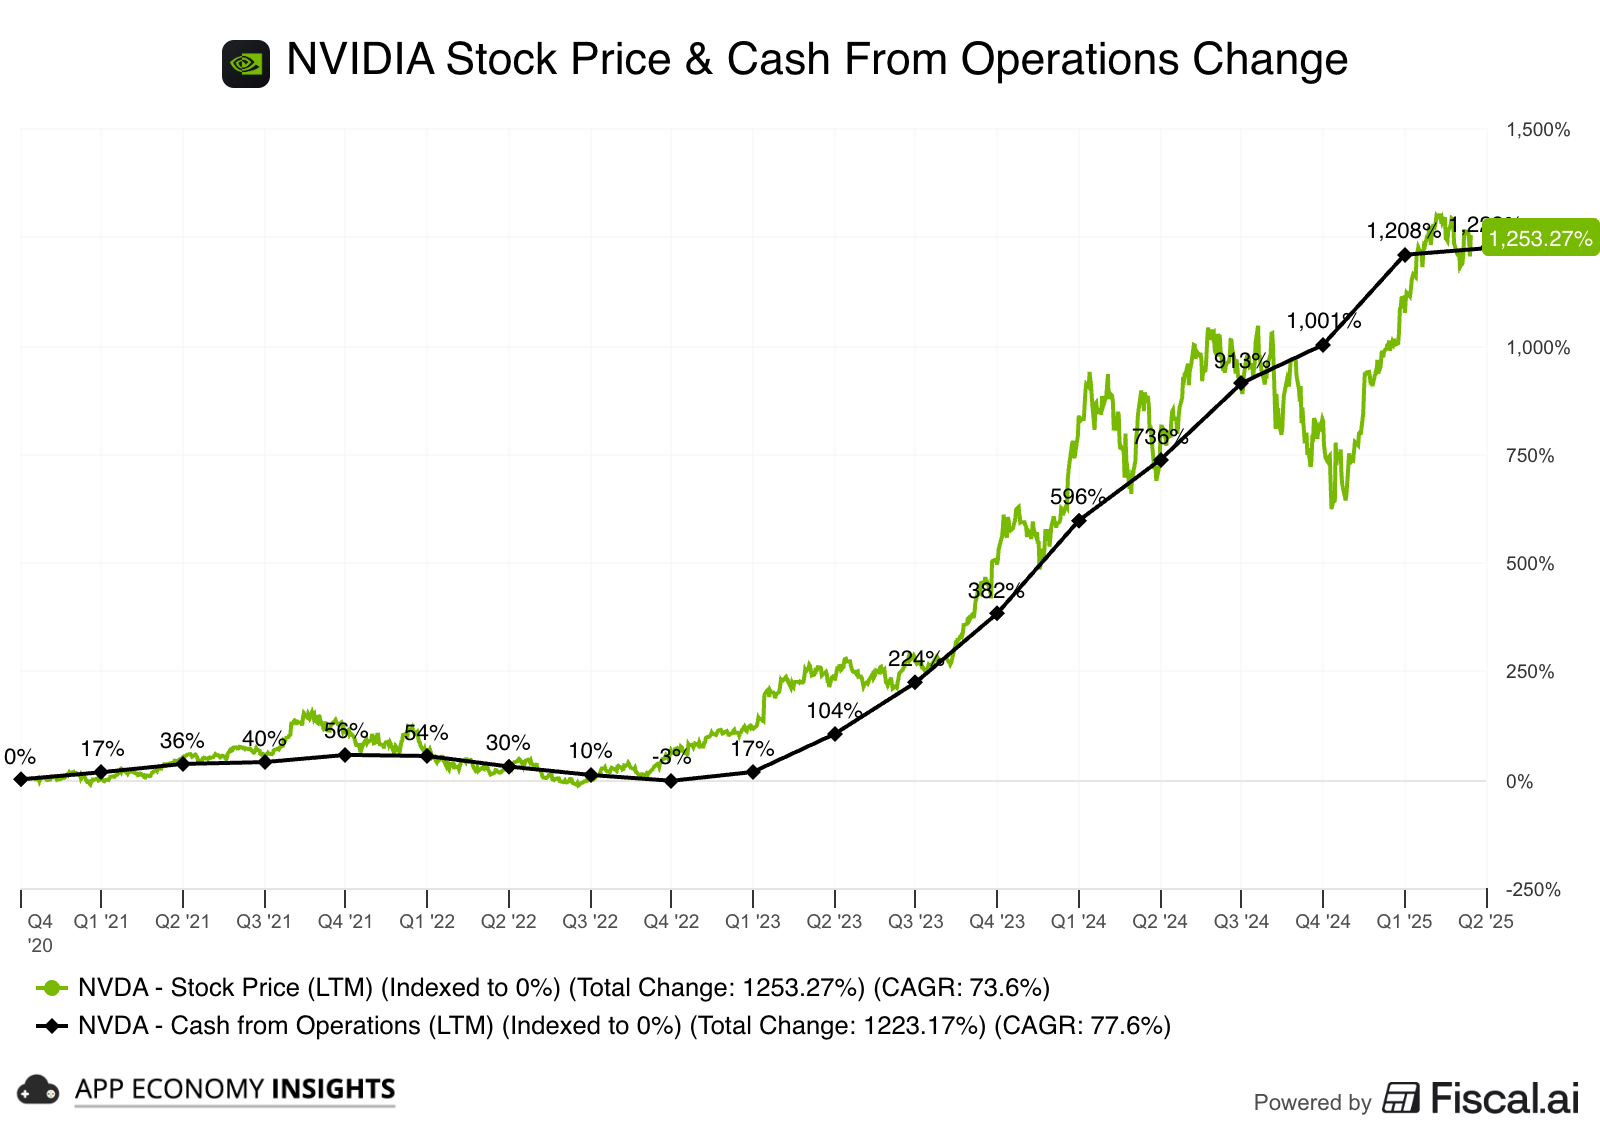
Now you’re comparing relative performance from a common baseline, great for understanding who’s actually outperformed since a catalyst (earnings, product launch, guidance reset).
Pro tip: Index fundamentals too (for example, Operating Income TTM indexed to 0%). It shows whose business compounded faster if you compare several companies.
4) Custom Metrics (turn your thesis into a number)
Use case: Track the exact formula your thesis rests on.
Ideas to try
Rule of 40: Revenue growth + margin of your choice.
Unit economics pulse: Gross margin over time.
Cash efficiency: Free cash flow margin over time.
The only limit here is your imagination. Here's an example with a margin trend analysis.
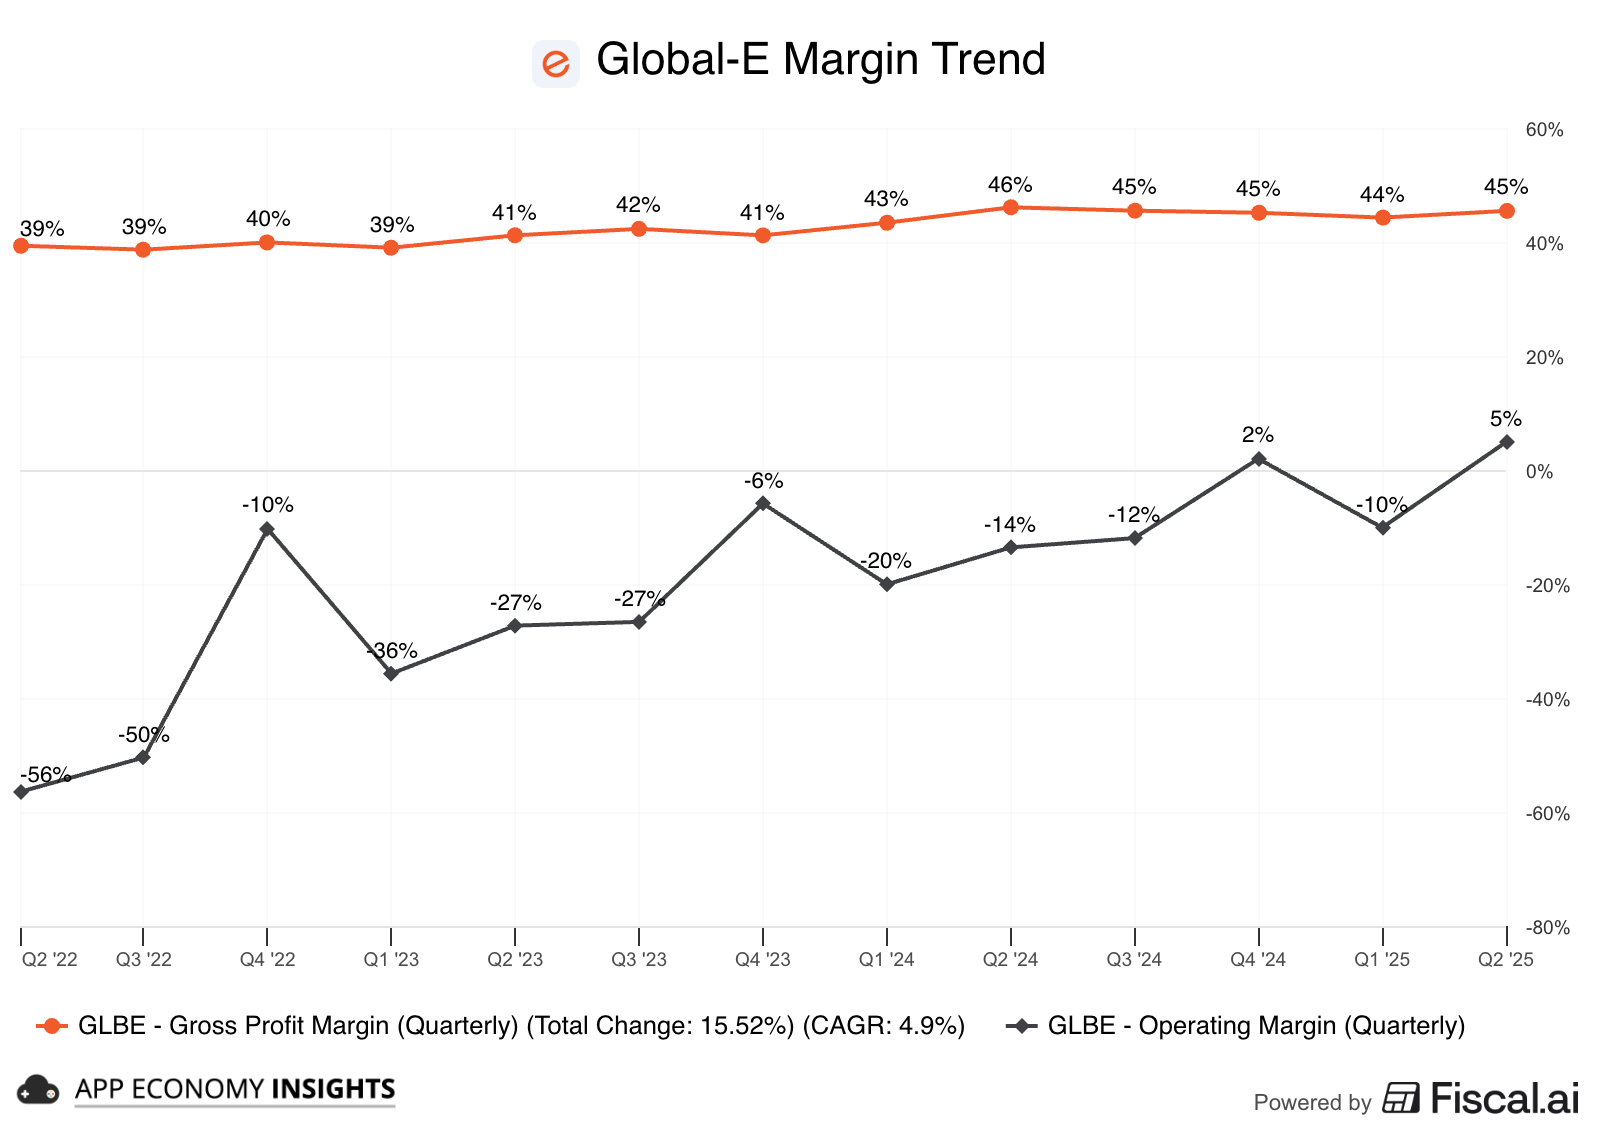
How to build it
Open Custom Metric.
Select your base fields: revenue, number of customers, you name it.
Build the formula.
Analyze it over time and between companies
Below is an example I created that pulls subscription revenue in % of total revenue for a software company.
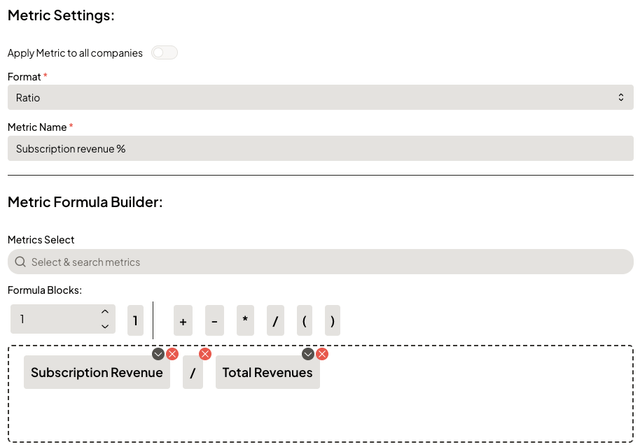
Pro tip: Save your custom metric and re-use it across tickers for peer comps in one click.
Why this matters to you
1) Better charts in every post
I can now visualize more metrics with finer control (timeframes, axes, segment selection, custom metrics, formulas), so our write-ups bring crisper insights.
2) You can replicate my charts easily
Fiscal.ai offers a free tier, which is the way I initially discovered the platform, and a great way to check it out.
Yahoo Finance is free, but it doesn’t offer a fundamental charting tool.
Ycharts is very powerful, but doesn’t offer company-specific segments and KPIs, and is cost-prohibitive ($300/month even on the standard plan).
Fiscal.ai‘s paid plans are much more affordable than YCharts. In fact, it’s nearly 8x cheaper (for example, Fiscal’s Pro plan is $39/month). And they have a proper free tier. So, when I share a chart, you can rebuild it, tweak it, and make it your own—without breaking the bank.
Bonus for our readers: Fiscal.ai is giving 15% off via our partner link.
What to expect in future write-ups
Do it yourself: Easily explore on your own comparisons by using the free charting tool offered by Fiscal.ai, so you can research alongside me.
Cleaner signals: More “price vs. business” views, so we separate momentum from fundamentals.
Repeatable templates: I’ll standardize the best layouts (price vs FCF per share, Indexed revenue vs peers, Rule-of-40 trendlines) so you can apply them to any company we discuss.
Your member perk
15% off Fiscal.ai paid plans with our partner link.
I get a commission if you opt for their paid plan through our link, but I believe you'll also love the free tier, which will already improve your research flow and greatly complement our work here.
As always, I only partner with tools I actively use, and I have personally reached out to them to secure this partnership.
Do you need this to follow along?
No. It’s an optional tool. But if you want to recreate charts and iterate for your own research or look up stocks that we don't cover, it’s the most cost-effective way to do it and truly an all-in-one platform.
Final word
The goal is simple: make your research faster, clearer, and more repeatable. Fiscal.ai helps us do exactly that. So expect improved visuals from me and a smoother path for you to dig in, compare, and build conviction on your own.
Try Fiscal.ai for free here
And if you make a killer chart, share it with us by replying to any of our emails! I’d love to feature member builds in future posts.
Disclosure: Fiscal.ai is a partner. If you use our link, it may support App Economy Insights at no extra cost to you.
I own AMD, AMZN, CRWD, GLBE, GOOG, META, SHOP, and ZS in App Economy Portfolio. I share my ratings (BUY, SELL, or HOLD) with App Economy Portfolio members. The Starter Stocks for 2025-2026 just came out.