

🚘 Gig Economy Shakeup
Earnings insights for Uber, Lyft & Instacart

Welcome to the Tuesday edition of How They Make Money.
Over 100,000 subscribers turn to us for business and investment insights.
In case you missed it:
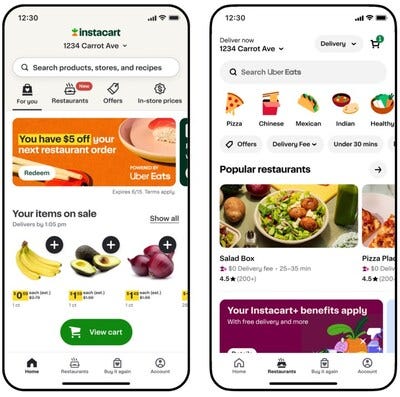
Uber Eats comes to Instacart: A Gig Economy Shakeup?
This unexpected partnership could be a game-changer. Here's the deal:
🍲 More orders for Uber Eats partners.
💳 Instacart gets an affiliate fee from Uber Eats orders.
📱 Instacart+ members get $0 delivery on orders over $35.
But wait, doesn't Uber Eats already deliver groceries? Yes, which makes this team-up even more intriguing. Could an acquisition be in the cards?
Uber CEO Dara Khosrowshahi explained in an interview:
“We believe our biggest growth opportunity is in the suburbs and less dense areas. That’s an area of strength for Instacart.”
Competition is heating up. Amazon recently announced a new grocery delivery subscription for Prime members. Walmart and Target also launched same-day delivery services.
To make sense of this shakeup, we're diving into the earnings reports of these gig economy giants. We'll analyze the numbers that truly matter:
💵 Gross Bookings: The total value of transactions on the platform.
% Take Rate: The cut these companies keep from each transaction.
🙋♀️ Active Users: The number of people using the platform.
🚗 Orders/Trips: The demand indicator.
Let's see who's winning (and losing) in this high-stakes battle for convenience.
Today at a glance:
Uber: As Advertised.
Lyft: Bumpy Ride.
Instacart: Amazon Looms Large.

1. Uber: As Advertised

🚗 Trips grew +21% to 2.6 billion (28 million per day on average).
🙋♀️ Monthly Active Platform Consumers grew +15% to 149 million.
💵 Gross Bookings grew +20% to $37.7 billion ($0.3 billion miss).
Mobility grew +26% to $18.7 billion.
Delivery grew +17% to $17.7 billion.
% Take rate: Mobility 30.2% (+1.3pp Y/Y), Delivery 18.2% (-2.4pp Y/Y).
What to make of all this?
🔍 The Bigger Picture: Uber generated a net loss during the quarter, mainly due to non-recurring legal charges and unrealized investment losses in public companies like Didi and Grab. Uber delivered an operating profit, which is what matters when evaluating profitability.
🛑 Misleading Delivery Take Rate: Delivery revenue was impacted by business model changes that classified some costs as a revenue reduction. So, Gross Bookings are the best indicator of the segment’s growth profile.
📢 Advertising as a Tailwind: Management expects Uber to cross a $1 billion run rate for advertising in 2024. Restaurant advertising reached 2% of Gross Bookings, and sponsored products (like groceries) could get a higher percentage. Uber is just starting to scale its sponsored items business outside North America.
📈 Adjusted EBITDA improved: It illustrates how much Uber keeps from the transactions on its platform. It grew 82% to $1.4 billion, a record 3.7% of Gross Bookings in Q1 (+1.3pp Y/Y), boosted by advertising. Remember that management excludes stock-based compensation (roughly half a billion per quarter) from this metric. Charlie Munger famously called adjusted EBITDA “bullshit earnings.”
🌎 Mixed Ride-Share Demand: While overall trips increased 21%, softer demand in Latin America and holiday timing contributed to a slight miss on Gross Bookings estimates. Uber's dominance in the US market remains strong, with a 72% share, according to Yipitdata (steady from a year ago).
👤 Users Keep Coming Back: Trips per user grew 6% to nearly 6/month. Not only is Uber expanding its reach, but it is also seeing more usage. Price is not the main factor in revenue growth. Engagement is.
🔮 Outlook in Focus: Despite healthy growth, Uber's Gross Bookings mid-range target of $39.5 billion in Q2 (+18% Y/Y) slightly missed Wall Street’s expectations of $40 billion.
Uber continues to attract users, increase engagement, and boost profits through new avenues like advertising. Maintaining this growth and achieving consistent profitability will be critical to reassuring investors.